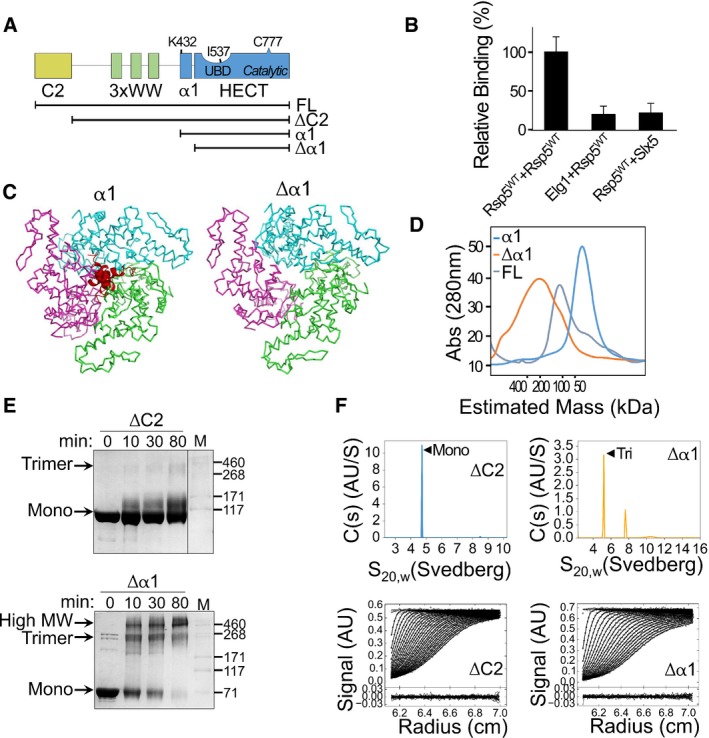
Figure 1. Removal of α1 alters the oligomeric state of Rsp5.

- Schematic representation of the Rsp5 domain architecture. Black strips below represent truncated proteins used in this study.
- Normalized, mean β‐galactosidase activity in a yeast two‐hybrid assay reporting association of Rsp5 with itself or with the negative controls, ELG1 or SLX5. Mean values and bars of standard deviation from triplicates are shown.
- Representation of a trimeric Rsp5 model in the presence (left) or absence (right) of α1 (red). The structure of Rsp5 (3OLM) was superimposed onto the E6AP trimeric structure (1C4Z), with its three HECT protomers depicted in green, pink and cyan. A clash of the α1 helices is apparent at the trimerization interface.
- Size‐exclusion chromatography of full‐length Rsp5 or of its HECT domain, with (α1) or without (Δα1) α1. Proteins were loaded on a Superdex 200 16/60 column, and elution was monitored by measuring absorption at 280 nm (A280).
- Time‐dependent cross‐linking of ΔC2 or Δα1 Rsp5 with 0.5 mM disuccinimidyl suberate (DSS). Samples were resolved by SDS–PAGE followed by Coomassie blue staining.
- Sedimentation velocity data, fits and residuals from analytical ultracentrifugation of ΔC2 or Δα1 Rsp5. Upper panels show continuous distributions analyses c(s) of the sedimenting species for ΔC2 (blue) or Δα1 (orange). Observed/calculated mass (oligomeric order), and distribution of species is presented in Table EV1.
