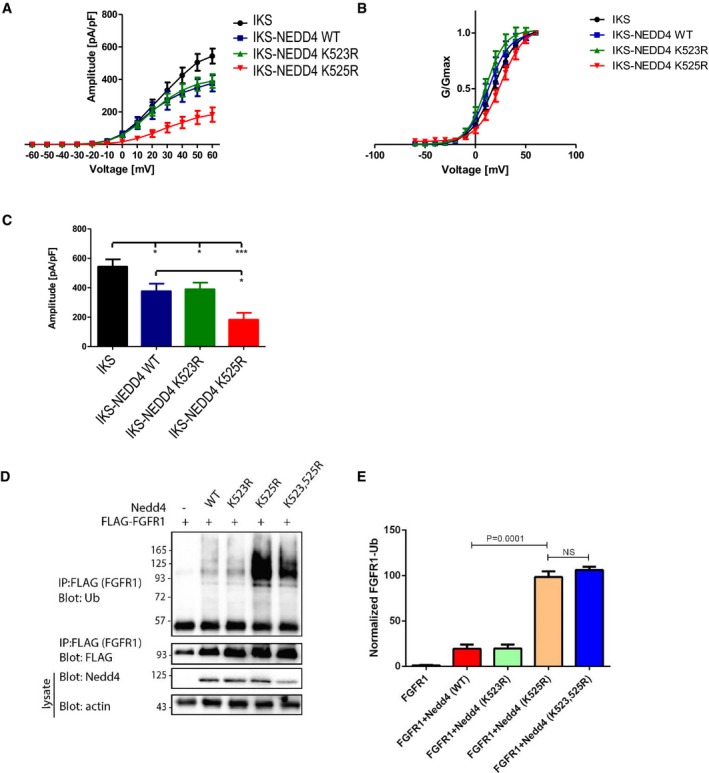
Figure EV4. Dissecting the role of individual lysine residues in Nedd4 regulation.

-
A, BQuantification (mean ± SEM) of (A) current‐voltage and (B) conductance‐voltage relationships of the recorded cells (n = 8–12), following co‐expression of IKS with Nedd4WT or mutants bearing individual lysine mutations, that is Nedd4K523R or Nedd4K525R. Cells were held at −90 mV. Membrane voltage was stepped for 3 s from −60 mV to +60 mV in 10 mV increments followed by repolarization to −60 mV for 1.5 s. Normalized conductance curves were fitted to a single Boltzmann function.
-
CQuantified (mean ± SEM) amplitude at −60 mV, for each cell type (n = 8–12). One‐way ANOVA; and Bonferroni's multiple comparison test; *P < 0.05, ***P < 0.001.
-
DRepresentative immunoblot of FGFR1 ubiquitylation (in the presence of serum) upon transfection of the indicated wild‐type and mutant human Nedd4 constructs.
-
EQuantified (mean ± SEM) ubiquitylated/total FGFR1 ratio from three separate experiments. P‐values are from Student's t‐test.
