-
A
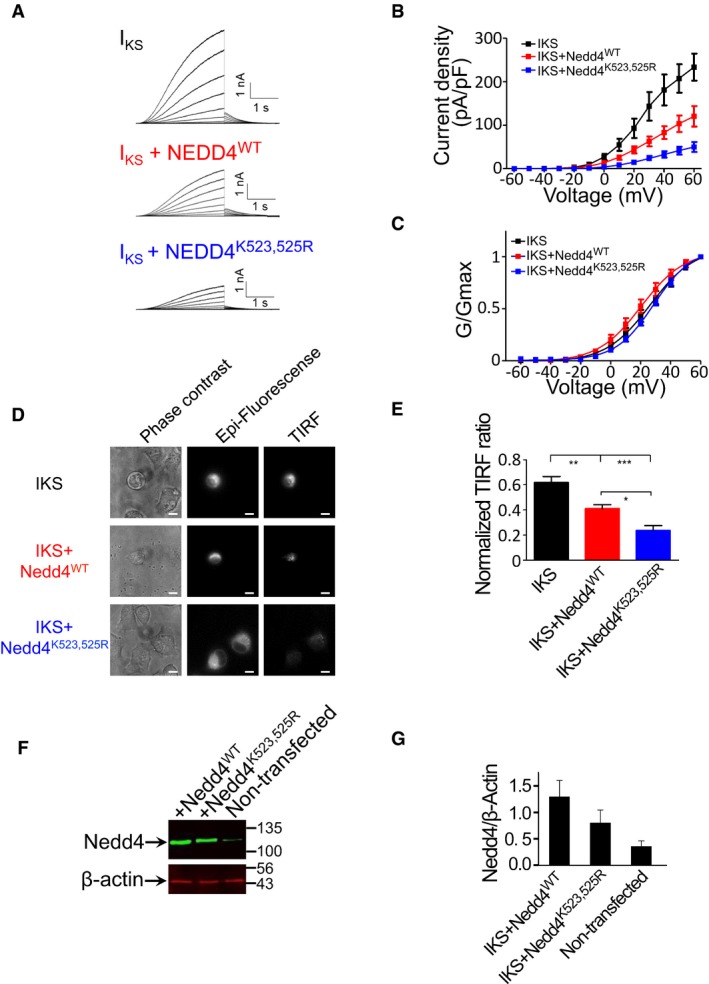
Representative current traces from CHO cells expressing either IKS (KCNQ1 + KCNE1), IKS + Nedd4WT or IKS + Nedd4K523,525R. Cells were held at −90 mV. Membrane voltage was stepped for 3 s from −60 mV to +60 mV in 10 mV increments followed by repolarization to −60 mV for 1.5 s.
-
B, C
(B) Current‐voltage (mean ± SEM) and (C) conductance‐voltage (mean ± SEM) relationships of the recorded cells (n = 10–11). Normalized conductance curves were fitted to a single Boltzmann function.
-
D
Phase contrast (left panels), epi‐fluorescence (central panels) and TIRF fluorescence (right panels) images of CHO cells expressing either IKS, IKS + Nedd4WT or IKS + Nedd4K523,525R. Scale bars: 10 μm.
-
E
Quantification (mean ± SEM) of the TIRF signals was normalized by the TIRF/epi‐fluorescence intensity ratio, using Fiji NIH viewer. n = 10–17; one‐way ANOVA and Bonferroni's multiple comparison test; *P < 0.05, **P < 0.01, ***P < 0.001.
-
F
Representative immunoblot with anti‐Nedd4 of total CHO cell lysates from non‐transfected cells and cells transfected with wild‐type or mutant Nedd4. Lysates were also blotted with antibodies against endogenous β‐actin.
-
G
Quantified (mean ± SEM) Nedd4/β‐actin ratio (n = 3).

