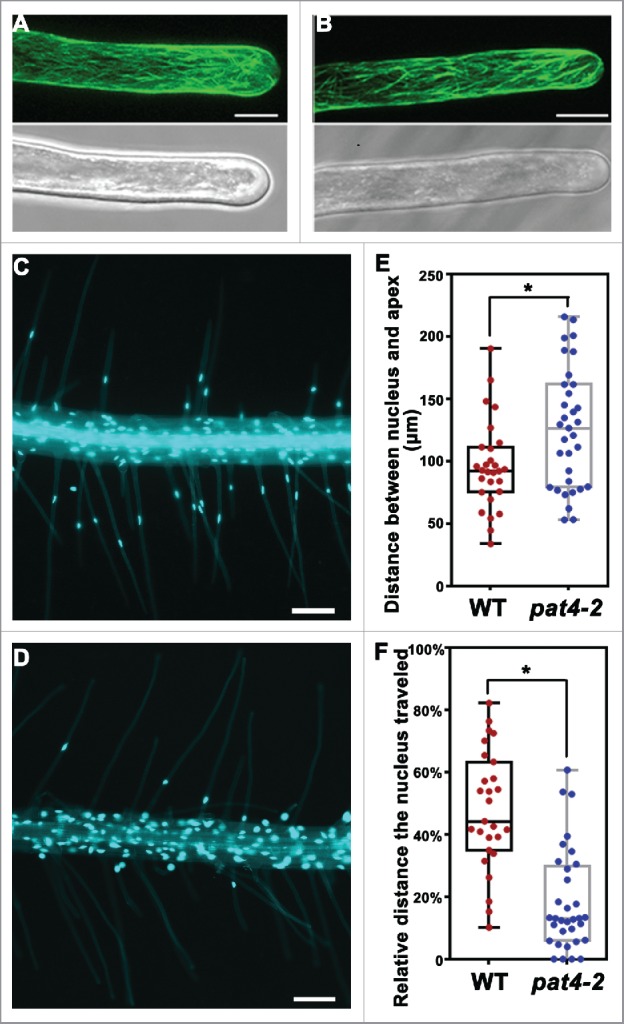
Figure 1.

Distribution of microtubule and nuclei in wild-type and pat4–2 root hairs. (A-B) CLSM projections of a growing root hair from Pro35S: GFP-MBD (A) or Pro35S: GFP-MBD; pat4–2 (B). (C-D) A representative primary root of wild-type (C) or pat4–2 (D) seedlings at 4 d after germination (DAG) stained with DAPI. (E) Distance between nucleus and the apex. (F) Relative distance the nucleus traveled (distance between the nucleus and the root hair base fractionated with root hair length). Results shown in (E) and (F) are means ± standard deviation (n = 30). Asterisks indicate significant difference (t-test, P < 0.05). Bars = 10 μm for (A-B); 100 μm for (C-D).
