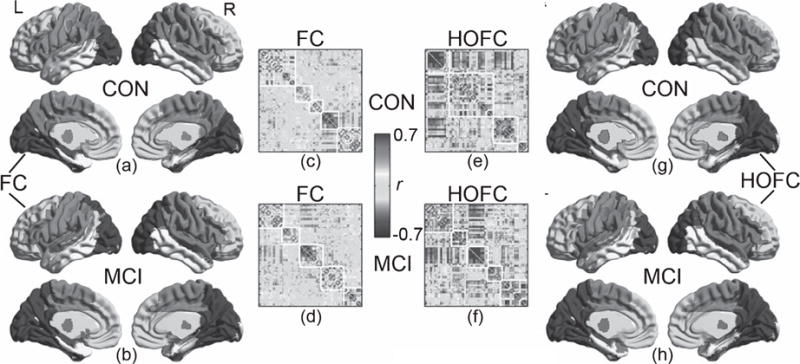
Fig. 5.

Modules detected by group-mean HOFC and FC matrices. The module detection was based on the Newman’s spectral optimization algorithm when the sparsity of both HOFC and FC-based networks was set to be 15%. A sparsity of 15% means that, for both groups’ mean HOFC and mean FC matrices, only the edges with the largest 15% connectivities were replaced with 1’s and those with lower connectivity strength were changed to 0’s. The modularity detections algorithm produced a modular label for each brain region (node). The matrices shown in (c – f) are the rearranged connectivity matrices according to the modular labels (i.e., the brain regions belonging to the same module were replaced to neighboring columns and rows). The border of the modules was delineated with white lines. The HOFC modules and the FC modules were visualized onto the brain surface, with different colors for different modules. For better comparison, modules at similar locations have the same color code. For FC network, both CON (a) and MCI (b) had five modules. However, for HOFC network, CON had four (g) and MCI (h) had five modules. See main text for the detailed description of these modules. For colored version of the figure, please see its online version.
