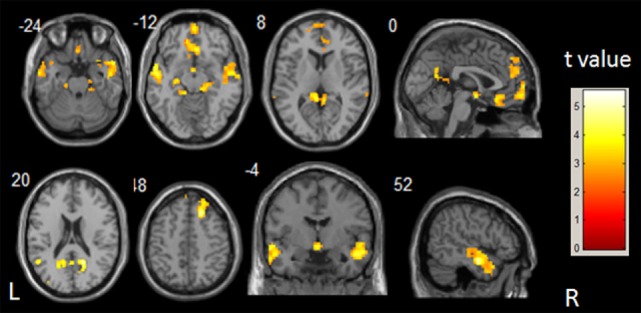
Figure 1.

t-Statistical different maps between the infantile spasms patients and healthy controls of functional connectivity value (two-sample t-test; p < 0.05, false discovery rate correction). The bar to the right indicates the t score level. L, left; R, right.
