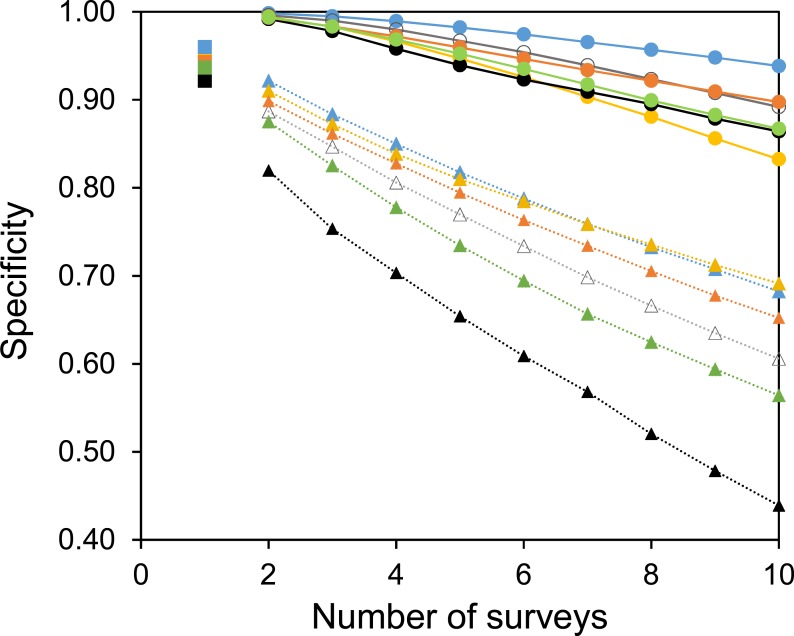
Figure 5. The specificity of surveys at each site.
Circles with solid lines are where species are only accepted if they were found in two of the multiple surveys. Squares are where there was only one survey. Triangles with dotted lines are where all observed species are accepted. Colours represent the same sites as in Fig. 4. Specificity is calculated from the number of true negatives, divided by the sum of the true negatives and false-positives.

