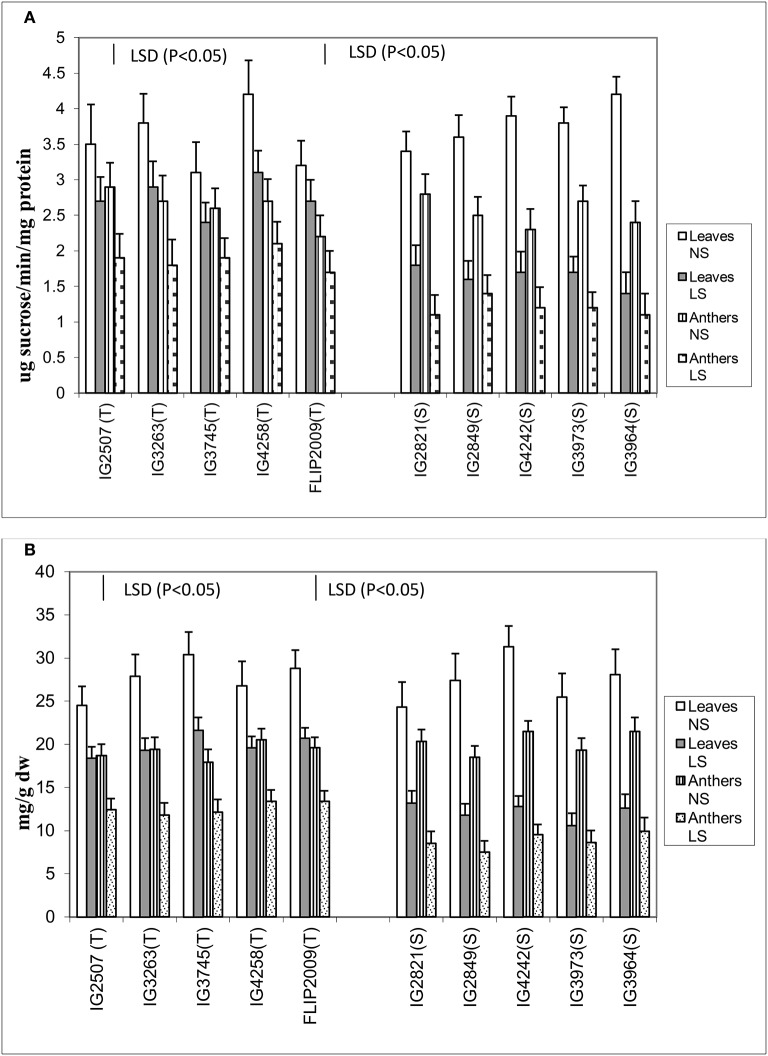
Figure 6.
(A) Sucrose phosphate synthase (SPS) and (B) sucrose (SUC) in leaves and anthers of normal-sown (NS) and late-sown (LS) lentil genotypes. Small vertical bars represent standard errors. LSD (P < 0.05; represented as small vertical line close to y-axis) for SPS (leaves: 0.43; anthers: 0.39) and SUC (leaves:1.9, anthers: 1.7); T, tolerant; S, sensitive.

