Figure 3.
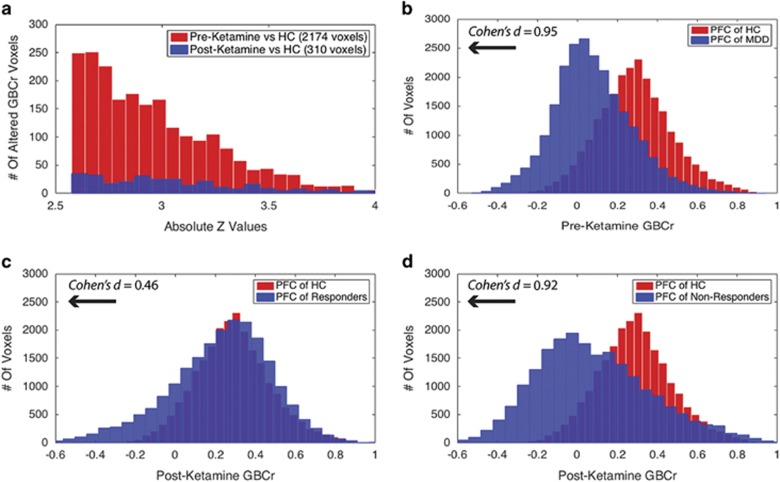
Distributions of GBCr at baseline and following ketamine treatment. (a) Distributions of absolute z-values of voxels showing significant reduction or increase of GBCr in MDD compared with HC prior to ketamine treatment (red) or 24 h after intravenous infusion of ketamine (blue). Although both distributions largely overlapped, the numbers of altered GBCr were numerically higher preketamine in each bin of the absolute z-values up to z~3.5. Of the 310 significant voxels postketamine, 123 were altered at baseline and 187 differed between groups only at the 24 h time point. (b) Distributions of GBCr in the anatomically defined PFC (delineated in Figure 1) in MDD and HC prior to ketamine treatment. The histograms depict comparable normal distributions in both groups with large effect size left shift in MDD reflecting overall reduction in PFC GBCr. (c and d) Distributions of PFC GBCr in HC and MDD responders (c) or MDD non-responders (d) 24 h after infusion of ketamine. The histograms reveal large overlap between the PFC GBCr distributions of HC and MDD responders (c). However, MDD non-responders continued to show large effect size left shift, suggesting a lack of normalization of PFC GBCr in this subgroup. GBCr, global brain connectivity with global signal regression; HC, healthy controls; MDD, major depressive disorder; PFC, prefrontal cortex. A full color version of this figure is available at the Neuropsychopharmacology journal online.

