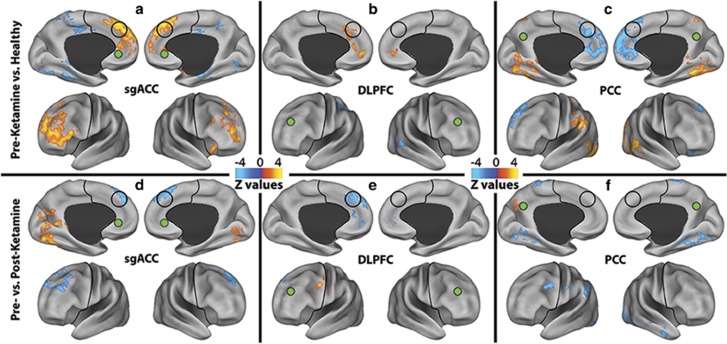
Figure 4.
Seed-based connectivity alteration in the affective (AN), cognitive Control (CCN), and default mode networks (DMN). (a–c): Clusters mark brain regions with significant connectivity reduction (blue) or increase (red–yellow) in MDD compared with HC at baseline. (d–f) Clusters mark brain regions with significant connectivity reduction (blue) or increase (red–yellow) in following ketamine treatment. The prefrontal cortex region is labeled with a black line. The seeds' locations are marked with green circles. The empty black circles locate the dorsal nexus area. DLPFC, dorsolateral prefrontal cortex; HC, healthy controls; MDD, major depressive disorder; PCC, posterior cingulate and precuneus area; sgACC, subgenual anterior cingulate cortex. A full color version of this figure is available at the Neuropsychopharmacology journal online.

