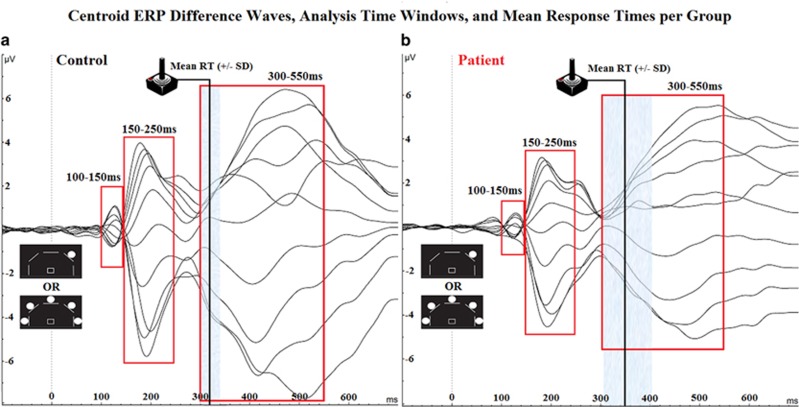
Figure 2.
Electroencephalographic (EEG) butterfly plots. Butterfly plots of centroid difference waveforms and time windows for analysis (100–150, 150–250, and 300–550 ms) for healthy comparison subjects (control; a) and schizophrenia patients (b). Vertical black lines indicate mean reaction time for each group with shaded areas indicating standard deviation.

