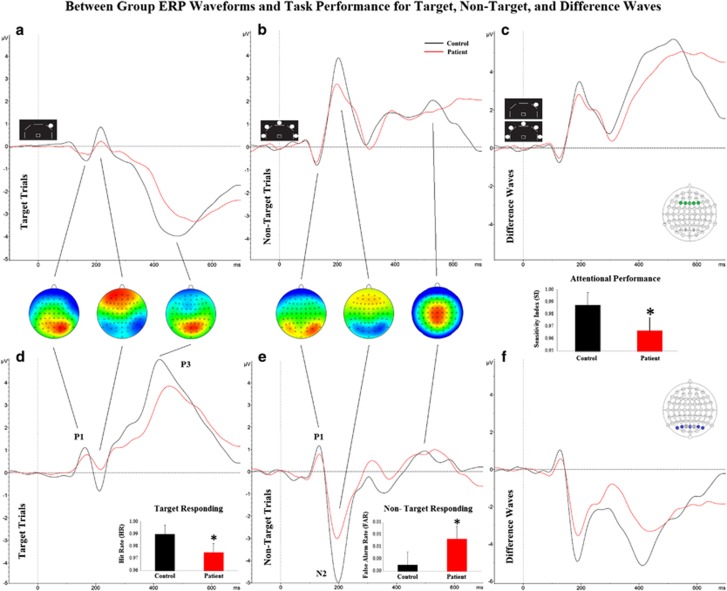
Figure 3.
Event-related potential (ERP) and behavioral data. Between group ERP comparisons for target trials (a,d), non-target trials (b,e), and difference waves (c,f) measured at the frontal centroid 3 (top row) and the occipital parietal centroid 8 (bottom row) of healthy participants (control) and schizophrenia patients. The P1, N2, and P3 ERPs are indicated. Inset topography plots show greatest scalp amplitude location for ERP peak. Inset bar graphs indicate between group behavioral performance within conditions, with schizophrenia patients exhibiting reduced target responding (hit rate (HR)), increased response disinhibition (false alarm rate), and impaired vigilance (SI). Behavioral data presented as mean+SEM, *p<0.05 compared with control. A full color version of this figure is available at the Neuropsychopharmacology journal online.

