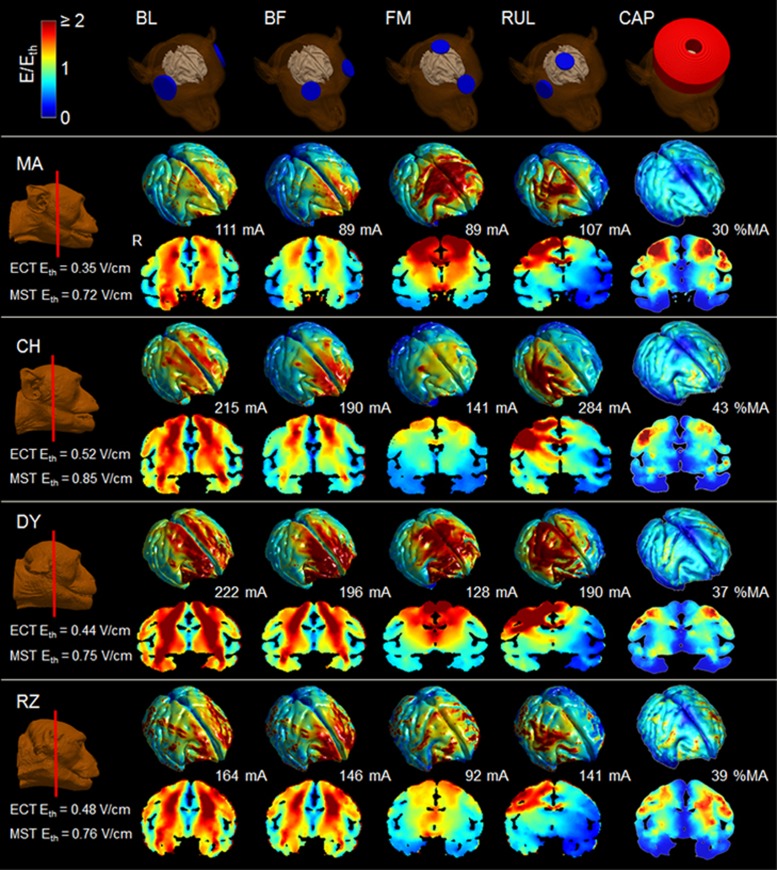
Figure 2.
E-field strength (E) relative to estimated neural activation threshold (Eth) at current amplitude corresponding to amplitude-titrated ST for BL, BF, FM, and RUL ECT as well as CAP MST (second to fifth columns, respectively) for the models of subjects MA, CH, DY, and RZ. The stimulation strength E/Eth is visualized on the cortical surface as well as in a representative coronal slice for each subject. The color map is clamped at an upper limit of 2 for good visibility. R, right.

