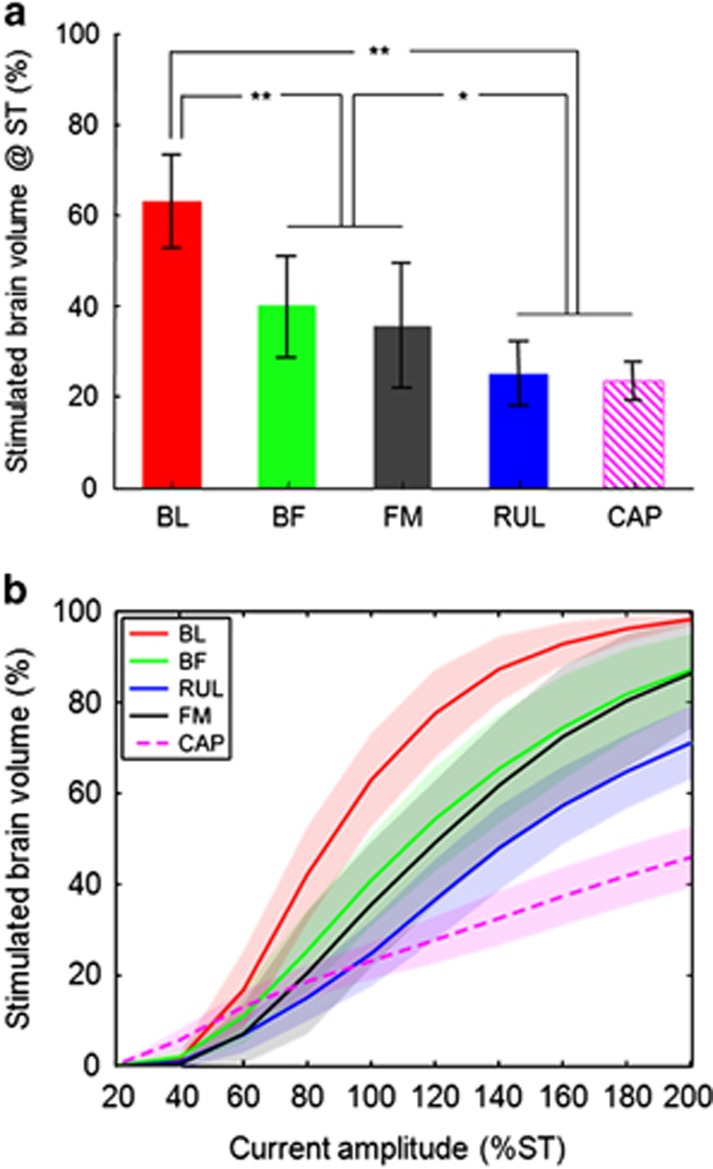
Figure 4.
Percentage brain volume stimulated above the neural activation threshold (E⩾Eth) (a) at the measured individual ST and (b) as a function of current amplitude relative to the individual ST for BL, BF, FM, and RUL ECT as well as CAP MST. In panel (a), the bars and error bars correspond, respectively, to the mean and SD of the individual averages of the four subjects. In panel (b), the lines and shaded regions correspond, respectively, to the mean and SD of the individual averages of the four subjects. Note that the values at the 100% ST point on the x axis in plot (b) are the same as the values in plot (a). **p<0.0001, *p<0.02.

