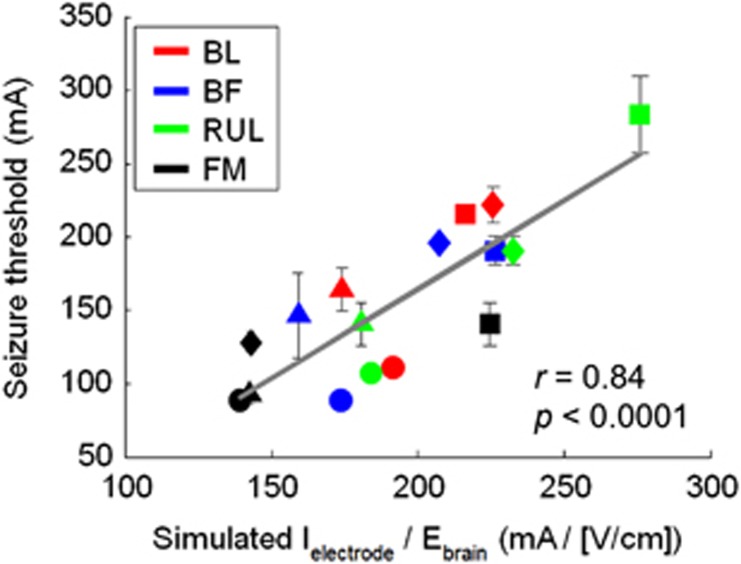
Figure 6.
Correlation between the average individual amplitude-titrated ST and the I/Ebrain ratio computed from individual E-field simulation models for the four ECT modalities. Each marker color represents a different ECT modality, as indicated by the legend. Each marker shape represents an NHP subject, (circle=MA, square=CH, diamond=DY, and triangle=RZ). The separate correlations for each ECT modality as well as for each MST are shown in Supplementary Figure S1.

