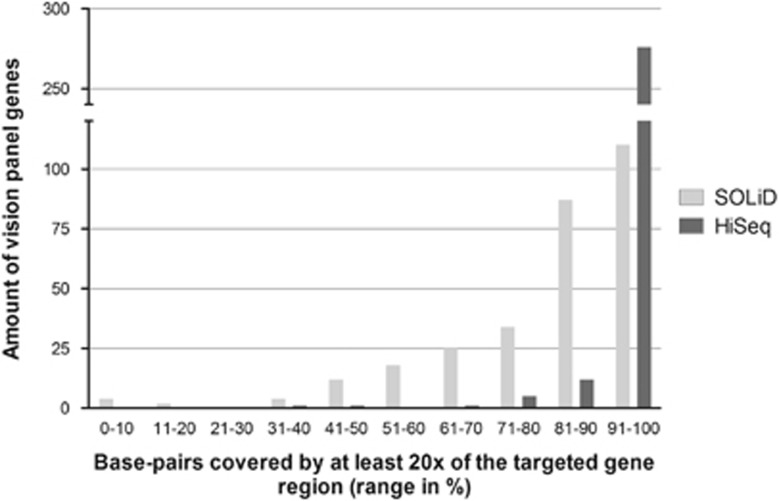
Figure 2.
Mean percentage base pairs covered by at least 20 × of the vision panel genes. For each of the 298 vision panel genes, the mean percentage of base pairs covered by at least 20 × of the targeted gene region was calculated for all 48 samples on the SOLiD and for all 218 cases run on the HiSeq platform. On both platforms, most genes had a mean percentage of base pairs covered by at least 20 × in the range of 91 till 100%. However, if this range is further dissected, the SOLiD platform had most genes in the range of 91 till 95%, while for the HiSeq platform this was in the range of 96 till 100%. Furthermore, the HiSeq platform had only three genes with a mean percentage of base pairs covered by at least 20 × below 70%, while for the SOLiD platform this was the case in 65 genes.

