Figure 7.
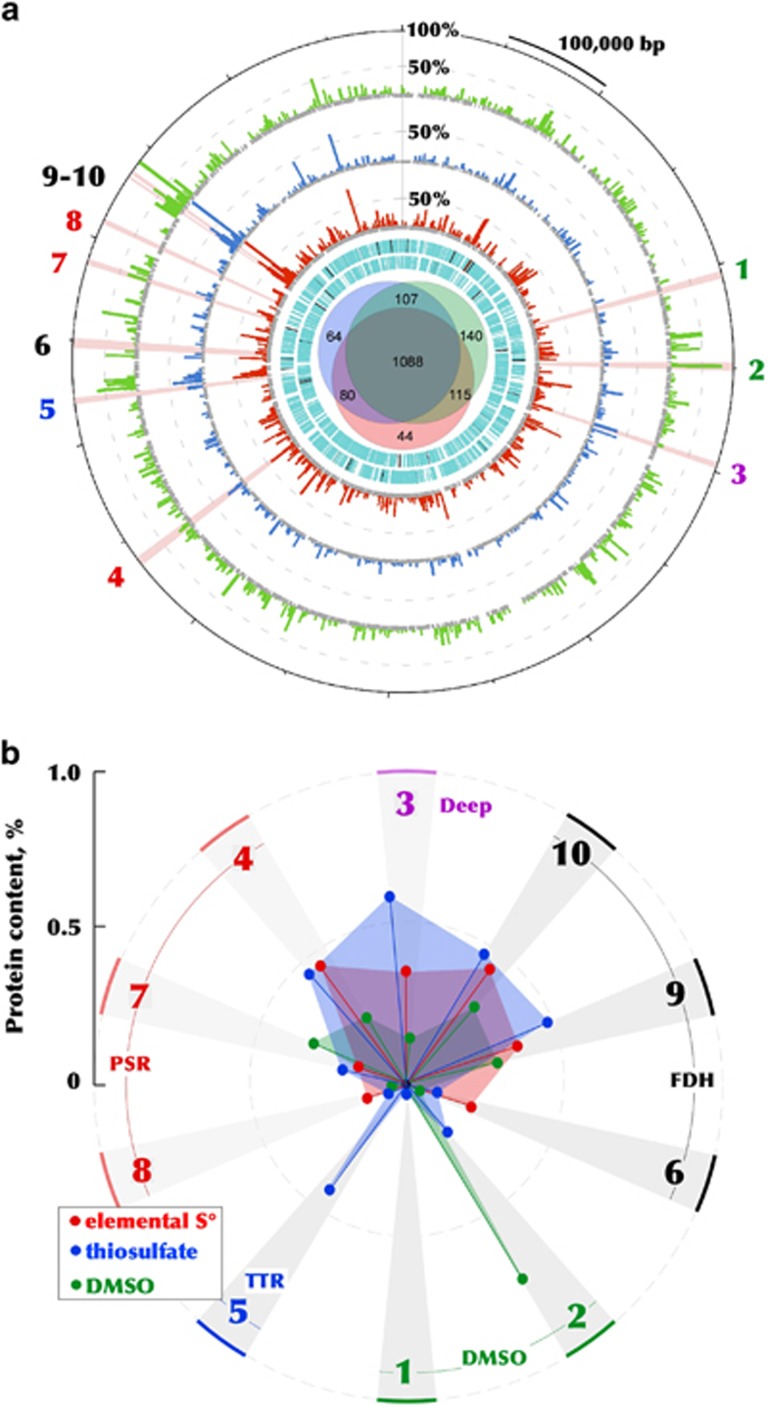
The 1.97-Mbp genome and differential proteome of Halodesulfurarchaeum formicicum HTSR1. (a) The outermost ring indicates the position on the genome map of the 10 sequentially numbered CISM enzymatic complexes (as in Figure 3 and Table S10), including two DMSO reductases DMSOR (1, 2), one unaffiliated CISM complex ‘Deep’ (3), three polysulfide reductases PSR (4, 7, 8), one thiosulfate reductase TSR (5) and three formate dehydrogenases FDH (6, 9-10). The second, third and fourth rings (histograms) are the relative abundances of proteins detected in corresponding proteomes, normalized versus the most abundant protein in all three proteomes, glycine cleavage system protein T (HTSR_1750, 100%). Two innermost cyan rings indicate predicted ORFs on the plus and minus strands, respectively. The Venn diagram in the centre shows the numbers of proteins detected in sulfur- (red), thiosulfate- (blue) and DMSO-respiring (green) cells. (b) Relative abundances of the 10 sequentially numbered CISM enzymatic complexes identified in corresponding proteomes. Key to protein annotations: 1. DMSOR (catalytic subunit HTSR_0423); 2. DMSOR (catalytic subunit HTSR_0517); 3. Deeply branched CISM (catalytic subunit HTSR_0627); 4. PSR (catalytic subunit HTSR_1347); 5. TSR (catalytic subunit HTSR_1522); 6. FDH (catalytic subunit HTSR_1576); 7. PSR (catalytic subunit HTSR_1661); 8. PSR (catalytic subunit HTSR_1699); 9. FDH (catalytic subunit HTSR_1736); 10. FDH (catalytic subunit HTSR_1740). Relative abundances of all proteins identified in the global proteome is provided in Supplementary Table S11.

