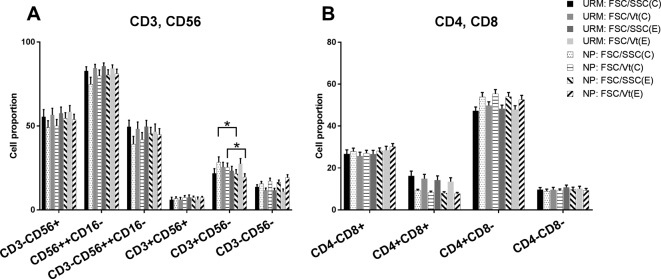
Figure 2. Cell percent counted by the four gating strategies.
(A) The cell percent of decidual T, NK, and NKT-like cells in the URM group and the normal pregnant group using four gating strategies. (B) Represents the percent of Th and Tc cells in the URM group and the normal pregnancy group using the four gating strategies. There was no statistical difference in the proportions of the dNK and NKT-like cells and the Th and Tc subsets when using the different gating strategies. The asterisk represents a statistically significant difference with P<0.05.

