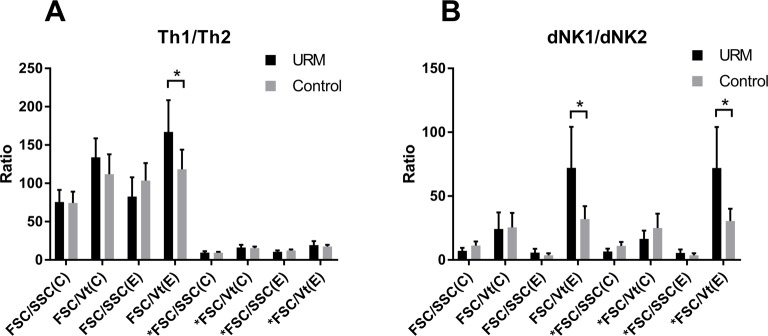
Figure 3. The type 1/type 2 ratio of the Th and dNK cells using the four gating strategies.
(A) The Th1/Th2 ratio in the URM group and the normal pregnancy group using the four gating strategies. There was a significant difference in the Th1/Th2 ratio in the URM group and the normal pregnant group with the FSC/Vt gating strategy. *FSC/SSC (C), *FSC/SSC (E), *FSC/Vt (C), and *FSC/Vt represent that we added the percent of the IFN-γ + IL-4 + double positive cells to both the IFN-γ + IL-4–Th1 and IFN-γ–IL-4 + Th2 percents. (B) The dNK1/dNK2 ratio in the URM group and the normal pregnancy group using the four gating strategies. The asterisk represents a statistically significant difference with P<0.05. *FSC/SSC (C), *FSC/SSC (E), *FSC/Vt (C), and *FSC/Vt represent that we added the percent of the double positive cells to both the dNK1 and dNK2 percents.

