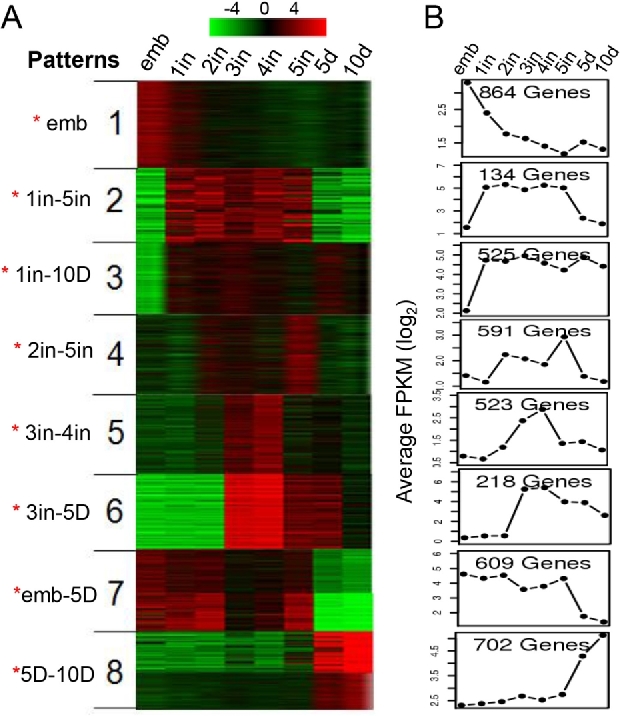
Figure 3.

k-means clustering for differentially expressed genes and expression patterns. (A) Eight expression patterns are shown on the left. Heat map shows the relative expression levels of each transcript (rows) in each sample (column). Normalized fragments per kilobase of exon per million fragments (FPKMs) calculated by Cuffdiff2 were log2-transformed and then median-centered by transcript. Heatmap was drawn based on clustering results. Red color represents higher expression; green represents lower expression. Note: red asterisks (*) on the left side of the figure indicate that expression at the corresponding stage is higher than the average expression level. Abbreviations: emb: embryo; 1in: 1st instar nymph; 2in: 2nd instar nymph; 3in: 3rd instar nymph; 4in: 4th instar nymph; 5in: 5th instar nymph; 5d: 5-day-old adult; 10d: 10-day-old adult. (B) The average of log2-transformed FPKM corresponding genes in each pattern.
