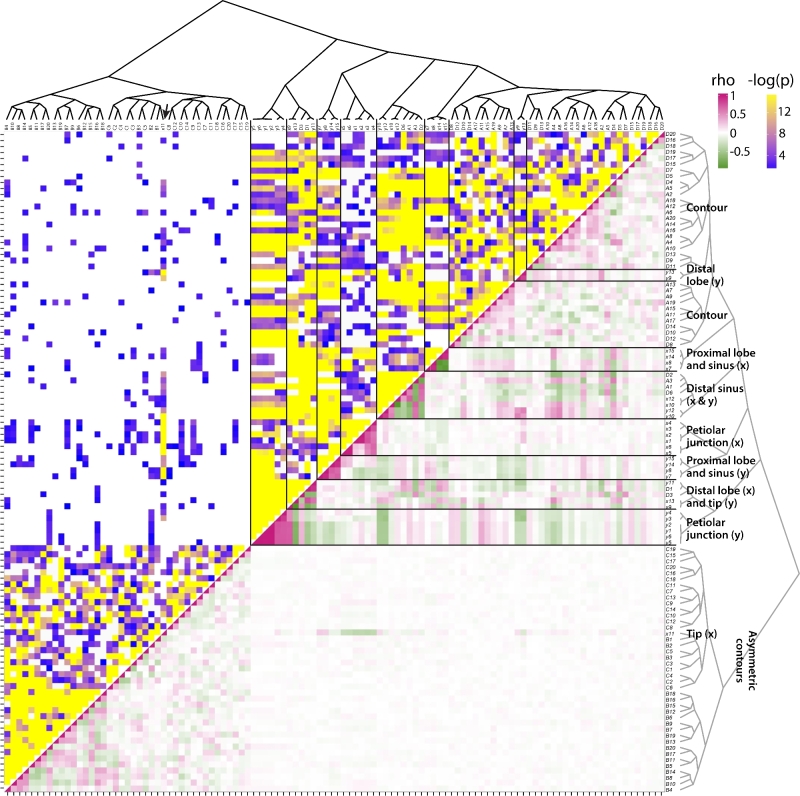
Figure 7.
Correlational matrix of landmark and EFD traits. Spearman's correlation matrix for morphometric features analyzed in this study. Upper half indicates –log10P value and lower half Spearman's rho between indicated traits. Morphometric traits, both landmark and the harmonic series, are indicated along the sides, arranged using hierarchical clustering, the topology of which is depicted as a dendrogram. Key groupings of landmarks indicating correlational associations with each other or EFD harmonics are indicated. Spearman's rho: low values, green; middle values, white; high values, magenta. −log10P values: low values, purple; high values, yellow; P < 0.05, no color.

