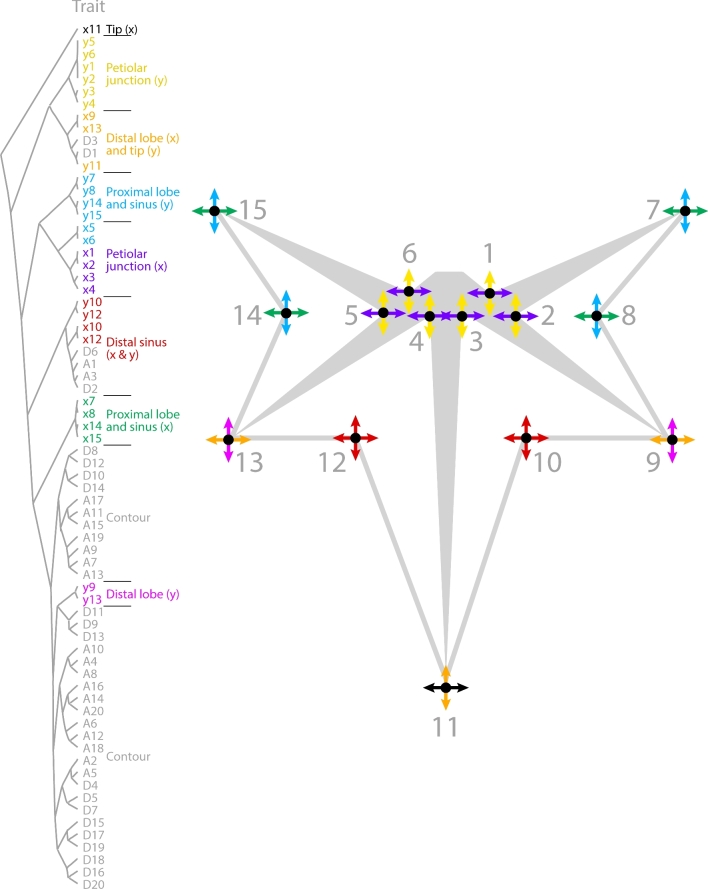
Figure 8.
Correlational relationships between vascular landmarks and leaf contours. Correlational relationships between x and y components of landmarks and EFD harmonics are indicated by dendrogram (left) and landmarks qualitatively on a representation of a leaf (right). x and y landmark components are independently depicted by arrows and colored as indicated to show major correlational sources of shape variance within Passiflora leaves.

