Fig. 3.
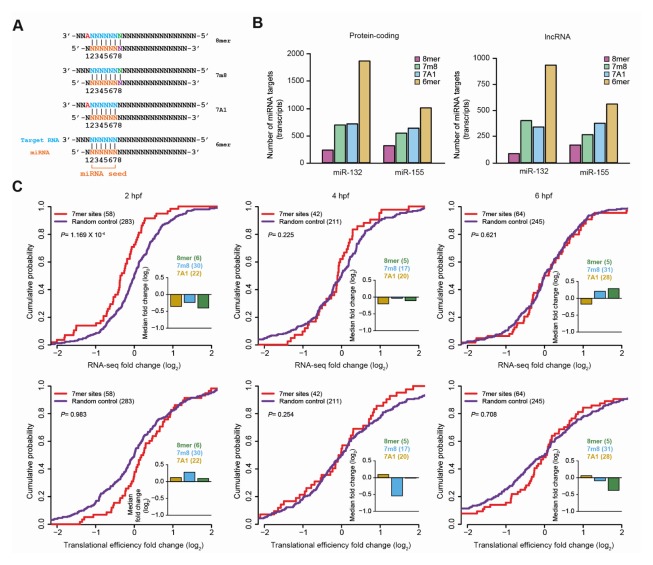
miRNA targeting on lncRNAs. (A) Canonical miRNA target sites. (B) The number of protein-coding mRNAs (left) and lncRNAs (right) embedding miR-132 or miR-155 target sites. In case of multiple sites, only the site with a greater impact was considered as the site corresponding to the transcript. (C) The cumulative distribution functions (CDFs) show the changes of RNA expression (top) and translational efficiency (bottom) for lncRNAs with miRNA (red) and random target sites (purple) (see Supplementary Material for more details), at each developmental stage in the zebrafish embryos. The number of miRNA and random target sites are shown in parenthesis in top left corner. P values were calculated using a one-tailed Wilcoxon rank-sum test and are shown at the top left corner. For each CDF, the median fold change (log2) and the number of 7mer sites of miR-132 and miR-155 (right), which are 8mer (green), 7m8 (sky blue) and 7A1 (dark orange), are depicted.

