
Figure 1.
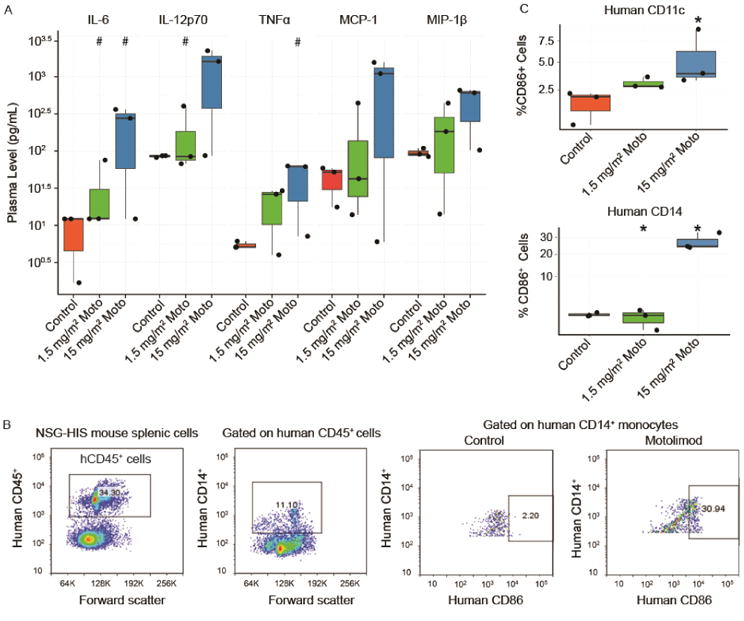
Motolimod induces human immune cell activation in the NSG-HIS mouse. (A) NSG-HIS mice (n=3 mice/group) were administered vehicle (control) or motolimod at 1.5 or 15 mg/m2. Plasma samples were obtained 6 hours after dosing and analyzed by HumanMAP® assay. A mixed-effect linear model combining all analytes showed a significant treatment effect at the highest dose (p≤0.01). Representative cytokines and chemokines are displayed. Increase(s) that approached but did not achieve statistical significance with respect to the control (p≤0.1; one-sided Wilcoxon rank-sum test) are identified with (#). (B) Representative images of flow cytometry analysis of human immune cells collected from NSG-HIS a spleen 6 hours after administration of vehicle (control) or motolimod 1.5 or 15 mg/m2 shows upregulation of the costimulatory marker hCD86 in hCD14+ spleen cells following treatment with motolimod. (C) Significant upregulation of hCD86 in hCD14+ and hCD11c+ cells in NSG-HIS mouse spleens 6 hours after dosing with motolimod 15 mg/m2 (n=3 mice/group). Significant increase(s) with respect to the control (p≤0.05; one-sided Wilcoxon rank-sum test) are identified with an asterisk (*).