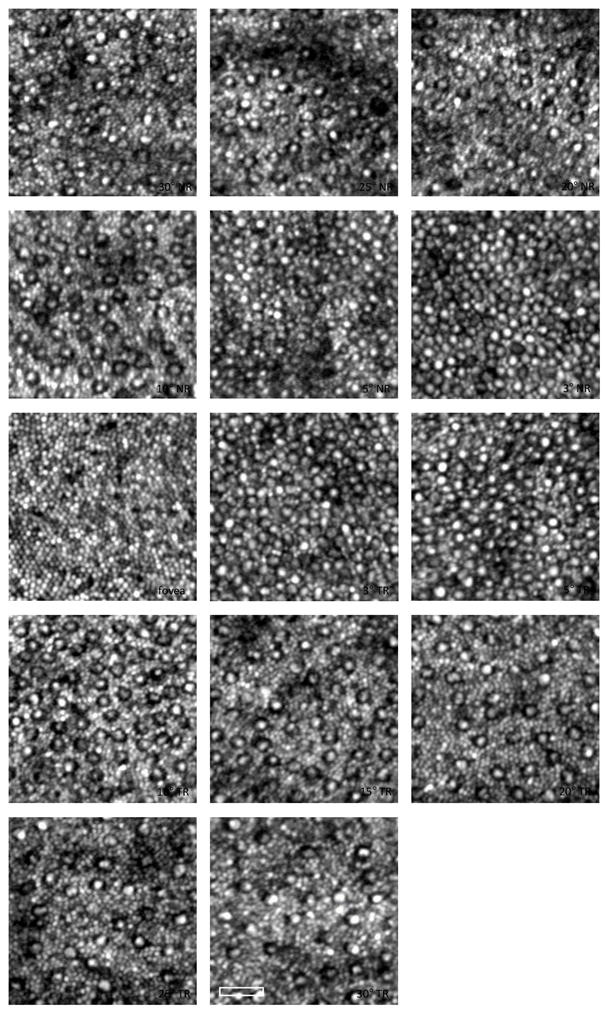
Figure 5.

AO-SLO images of the cone and rod mosaic at locations spanning 30° NR to 30° TR for a normal human subject. Logarithmic intensity scaling to enhance the visualization of the rod photoreceptors. Each image is the registered average of ~50 frames. The scale bar is 25 μm. At large eccentricities an increase in the rod spacing was observed. (Wells-Gray et al., 2016)
