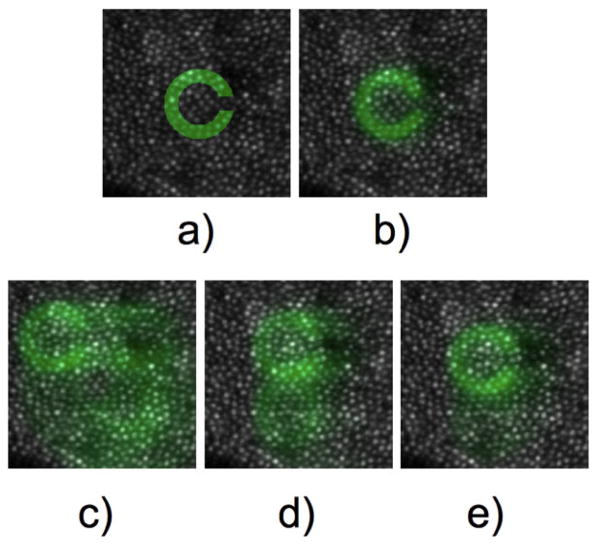
Figure 6.
Figures show an example image of the cone mosaic overlaid in green with intensity patterns (retinal stimulation) that would result from stimuli presented to the retina. Panel a) shows sharp Landolt C, panel b) shows a Landolt C blurred by the optical components of the eye, panels c), d), and e) show three examples of the blurred Landolt C translated on the retina by fixational eye movement over a period of 100ms. Images have been scaled to represent a Landolt C with a gap equal to twice the resolution limit of the eye. From Young et al. (in prep.)

