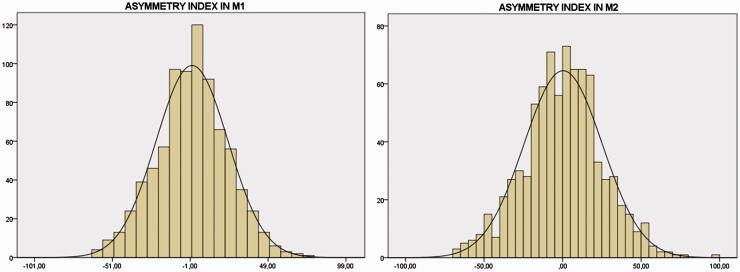
Figure 4.
Distribution of asymmetry indexes in proximal (M1) and distal (M2) segments of MCA. The black line depicts the normal distribution. Horizontal axis: non-dimensional index of asymmetry as calculated according to Zanette’s formula14: positive cases denote higher velocity in the right side MCA, negative cases denote higher velocity in the left side MCA. Vertical axis: frequency as number of subjects.

