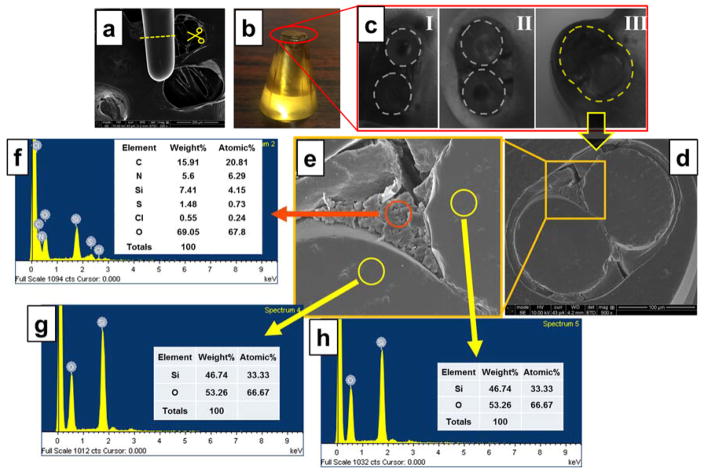
Figure 2.
Probe characterization by SEM and EDS analysis. a) SEM image of probe tip; b) the epoxy module immobilized several finished probe within it; c) three different probe cross-sections; d) SEM image of cross section of the dual-core double-fiber twisted pH probe; e) magnified image of square area in (d); f) EDS scanning result of red-circled area in (e); g) and h) EDS scanning results of yellow-circled areas in (e).

