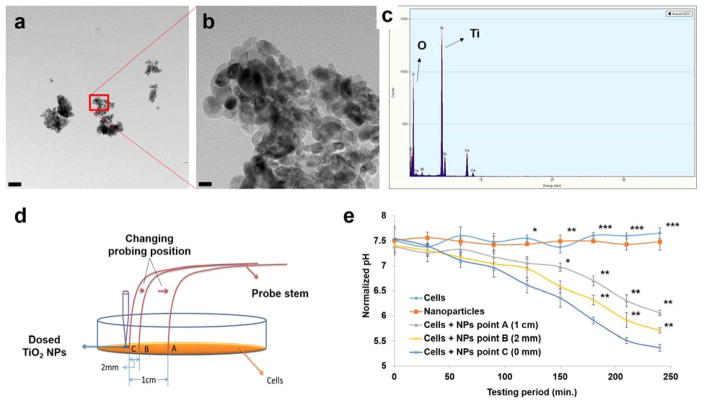
Figure 4.
TiO2 NPs characterization and determination of the probe’s spatial resolution. a) TEM image of applied TiO2 NPs, and b) zoom-in image of the NPs squared in a). c) EDS scanning result showing chemical composition of the TiO2 NPs. d) Schematic of how to test the spatial resolution of the pH micro-probe. E) Four-hour continual pH monitoring of cells + NP response at three different spots as shown in d), and compared with cell-only and NP-only groups. Statistical significance is interpreted as a p-value of <0.05 (*), <0.01 (**) as well as <0.001 (***). Scale bar: a) 200 nm; b) 20 nm.

