
Figure 2.
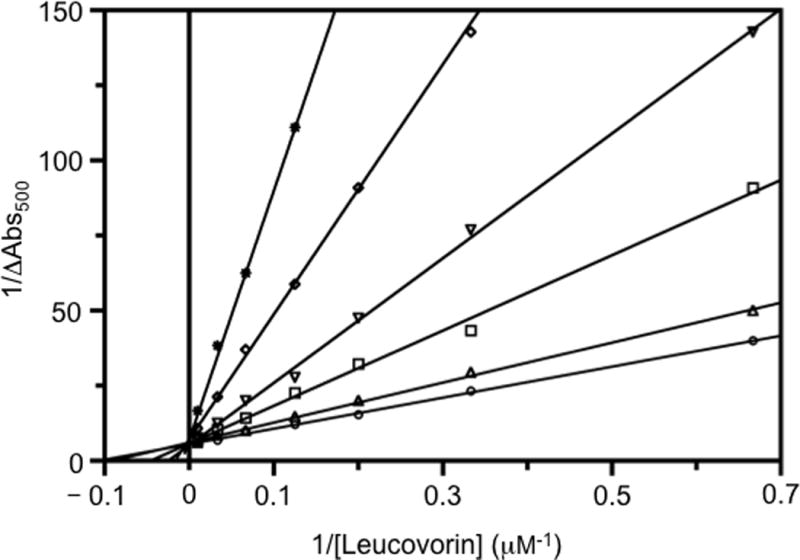
Double reciprocal plots showing lometrexol (LTX) inhibition. Absorbance changes at 500 nm (plotted as 1/ΔAbs500) were measured upon the addition of leucovorin to a solution of 5.5 μM hcSHMT containing glycine and LTX. Assays were carried out varying the concentration of leucovorin at fixed glycine concentration (3 mM) and at various concentrations of LTX (μM): 0 (◦); 7 (▵); 15 (▪); 30 (▫); 60 (▽); 125 (◊); 200 (×); 300 (∗). The continuous straight lines through the experimental points were obtained from the independent linear fitting of data.