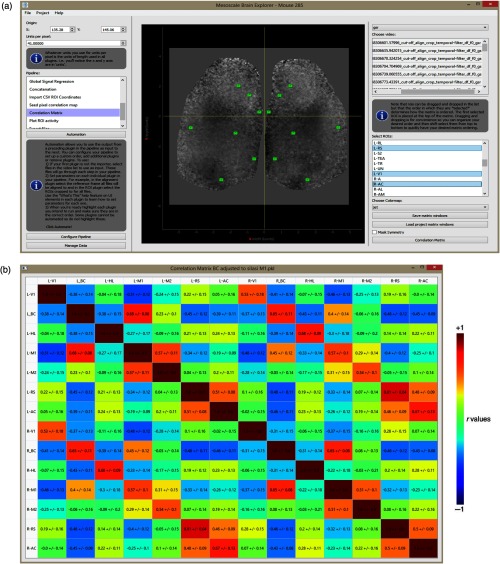
Fig. 7.
Correlation matrix for selected RoIs with GSR (a) UI of the correlation matrix plugin from where RoIs are selected along with image stacks to generate connectivity matrices. A single image depicting instantaneous is shown for RoI placement. (b) Mouse #0285 correlation matrix following collection of spontaneous activity via automated headfix protocols. The data are presented in units of Pearson correlation (-value) and the stdev reflects variability of -values between repeated 31 trials.

