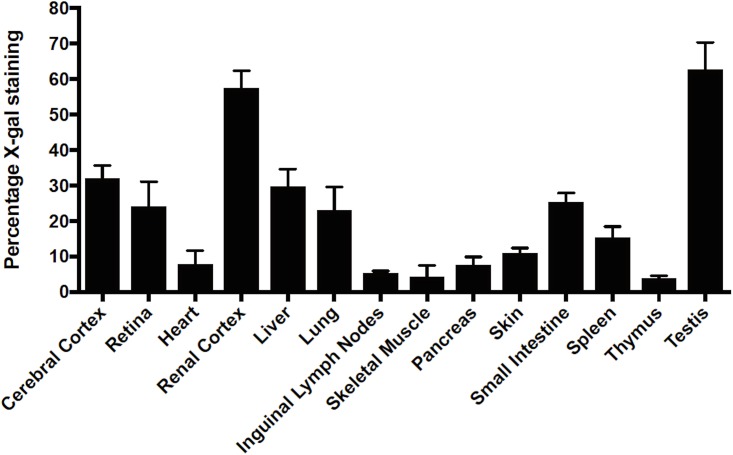
Fig 6. Quantitative representation of X-gal staining.
Image quantification was done using MatLab (MathWorks, Apple Hill Drive, MA, USA), as described in the material and methods section. 7 animals each of control (Abcf1+/+; no β-geo) and heterozygotes (Abcf1+/-; expressing β-geo) were sacrificed, tissues were extracted and staining intensities were measured. The error bar represents the standard deviation. Percentage 1–10% is characterized as light or faint staining, 10–40% as intermediate staining and greater than 40% as intense staining.

