Fig. 4.
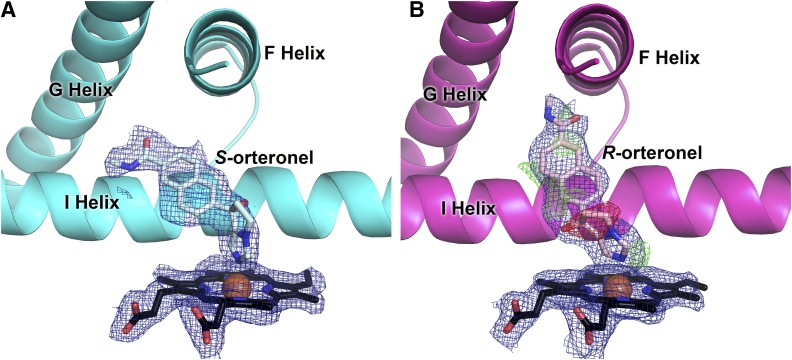
The contrasting ligand density in molecules C/D (A) compared with molecules A/B (B) in the 2.2 Å structure of CYP17A1 with orteronel supports binding of different enantiomers of orteronel in different molecules of the structure [(S)-orteronel in (A); (R)-orteronel in (B)]. Simulated annealing 2Fo − Fc composite omit maps (contoured to 1.0 σ) are shown as blue mesh. (R)-orteronel, modeled into molecules A/B of the structure (B), does not fully satisfy electron density as indicated by the simulated annealing composite omit Fo − Fc map for molecule A (negative density shown in red mesh and positive density shown in green mesh, contoured to 3.0 σ), which may indicate a small amount of disorder. The same Fo − Fc map for (S)-orteronel indicates an excellent match between the density and the ligand model and thus is not shown for clarity.

