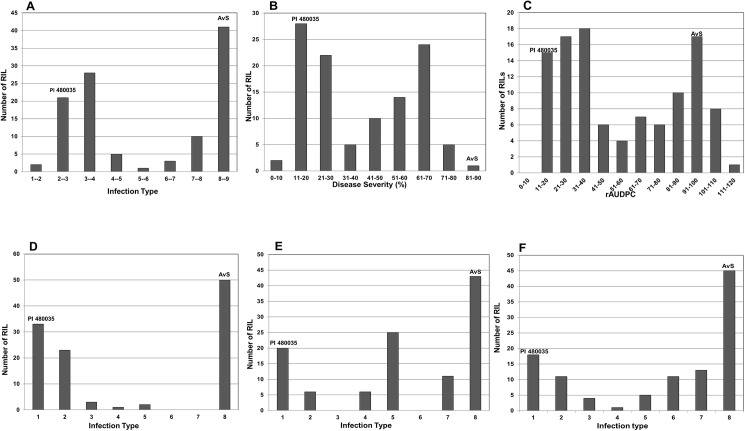
Fig 1. Histograms for the AvS × PI 480035 population for the distribution of seedling infection types (IT) for three Puccinia striiformis f. sp. tritici races and mean values of IT, disease severity (DS), and relative area under disease progress curve (rAUDPC) across all seasons and environments (Pullman 2013, Pullman 2014, and Mt. Vernon 2014).
(A) Mean IT; (B) Mean DS; (C) Mean rAUDPC; (D) IT for race PSTv-14; (E) IT for race PSTv-37; and (F) IT for race PSTv-40.

