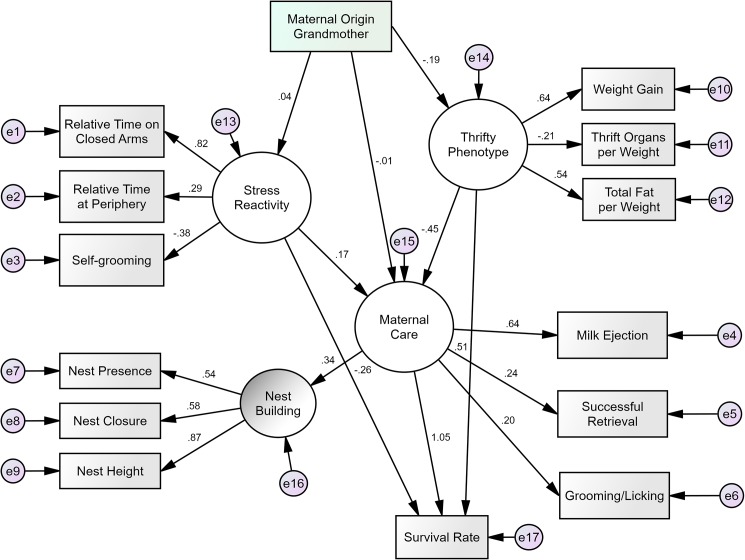
Fig 3. Revised model of the relationship between maternal origin, stress reactivity, thrifty phenotype, maternal care, and offspring survival.
The model overall had an excellent fit to the data. Small circles with an “e” represent error (i.e., leftover variance due to flaws in measurements and estimations). Arrows going out of the latent factors (big circles) represent factor loadings, while all other arrows represent regression weights. All parameters shown are standardized.

