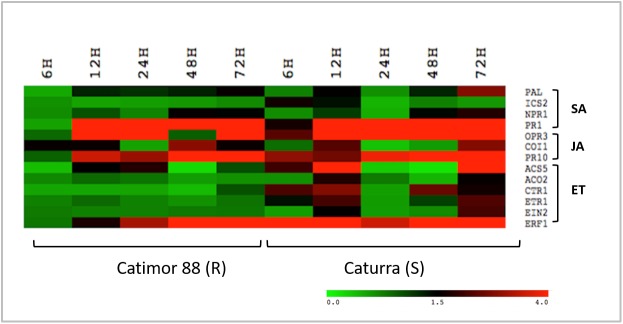
Fig 4. Expression analysis of SA, JA and ET pathway related genes in non-inoculated hypocotyls of Catimor 88 (R-resistant) and Caturra (S-susceptible) vs inoculated hypocotyls with C. kahawae.
Heatmap was colored according to the log2 ratio of expression, where green indicates lower expression, red indicates higher expression and black indicates no expression (see the color scale); in columns are the time-point studied (6, 12, 24, 48 and 72hpi) and in the rows the genes analyzed.

