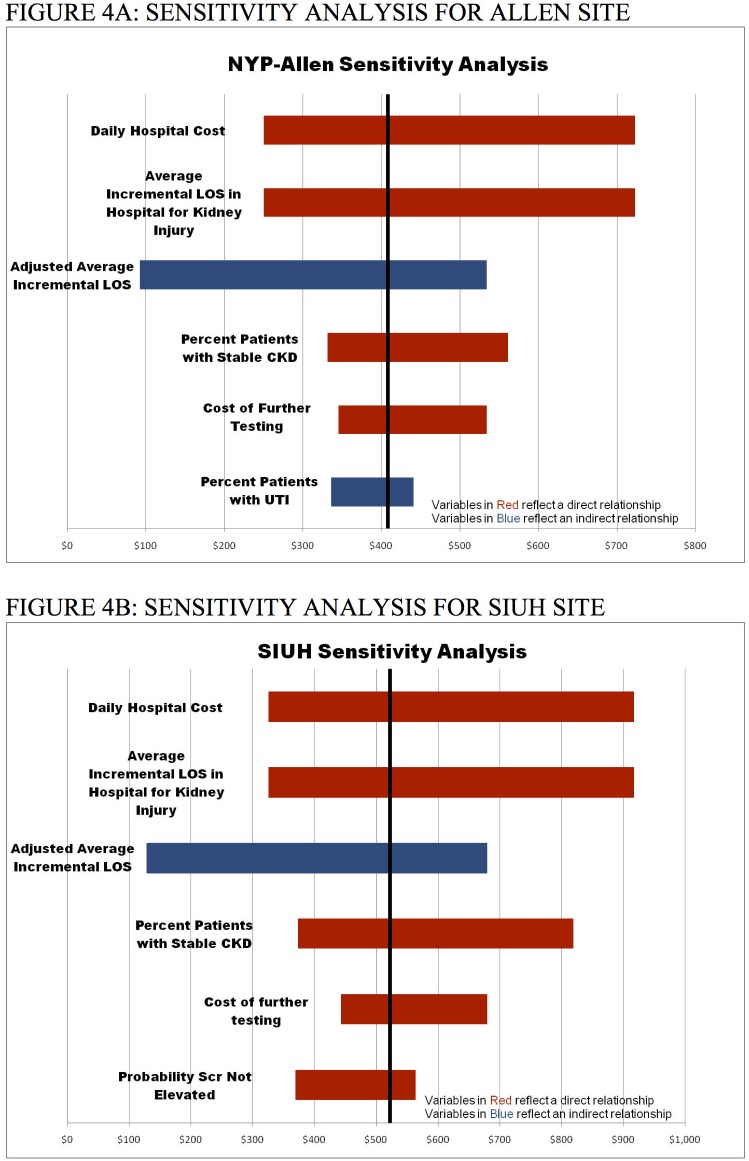
Fig 4. Sensitivity analysis.
The sensitivity analysis recalculates the net expected cost of each strategy (Scr vs. uNGAL+Scr), varying one model input at a time to its high and low values relative to its baseline value. At both sites, costs of uNGAL+Scr remain lower for each scenario examined in the sensitivity analysis. At NYP-Allen and SIUH, the results are most sensitive to hospital costs and length of stay, costs of additional testing, and the percent of patients with CKD.

