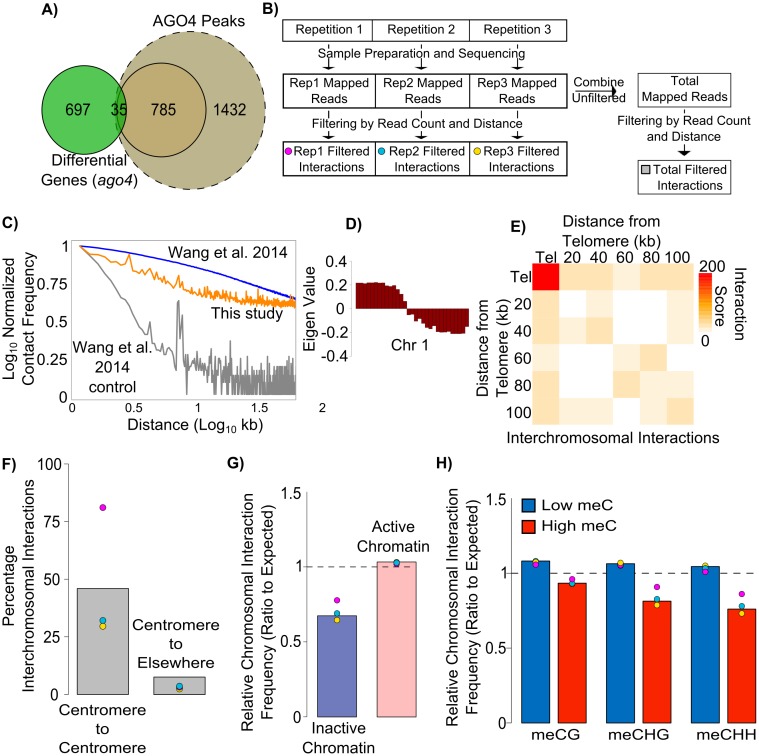
Fig 1. Chromosomal interactions are inhibited in non-centromeric heterochromatin.
(A) Overlap between genes with differential expression in the ago4 mutant (green) and genes with AGO4 peaks defined using high confidence (brown) or lower confidence (light brown) score cutoffs. AGO4 binding to a gene is defined as binding within a region from 2.5 kb upstream of the TSS. (B) Overview of Hi-C data analysis. Hi-C was performed in three biological replicates where each replicate was independently mapped and interactions were scored and filtered by read count and distance. Additionally, total reads were combined and then filtered. Each replicate as well as the combined data are used in the analysis. (C) Decay curves of Col-0 Hi-C compared to previously published DpnII datasets. Reads were aligned to DpnII fragments and kept if >3 DpnII sites apart. These were assigned to 250bp genomic bins and plotted. Col-0 Hi-C presented here (orange) compared to Col-0 Hi-C published by Wang et al. [29] (blue) and their reverse-crosslinked control (grey). (D) Self-association of chromosome arms. Eigenvector plot of contact correlation along chromosome 1. (E) Preferential association of telomeres. Metaplot of inter-chromosomal interactions at telomeres and the surrounding regions in 20 kb bins. (F) Centromeres preferentially interact with other centromeres. Interactions are plotted as a percentage of total high confidence inter-chromosomal interactions. Individual repeats are color-coded as represented in Figure 1B. Gray bars indicates levels found from combining reads before filtering and does not represent the average of three repeats. (G) Non-centromeric inactive chromatin is inhibited from forming chromosomal interactions. Interactions present in Col-0 were plotted if one side was found in either inactive or active non-centromeric chromatin bins defined in S1H Fig. These were plotted as a ratio to the expected (calculated from random bins). Bars represent data from combined replicates while points represent individual replicates color-coded as in Figure 1B. Significance calculated by a t-test of replicates, p≤0.017. (H) Chromosomal interactions are inhibited at loci with methylated DNA. Interactions present in Col-0 were plotted if one side was found in either low or high DNA methylation 250bp non-centromeric bins defined in S1K–S1M Fig. These were plotted as a ratio to the expected (calculated from random bins—dashed line). Bars represent data from combined replicates while points represent individual replicates color-coded as in Figure 1B. Significance calculated by a t-test of replicates, p≤0.05 for meCG, meCHG, and meCHH.

