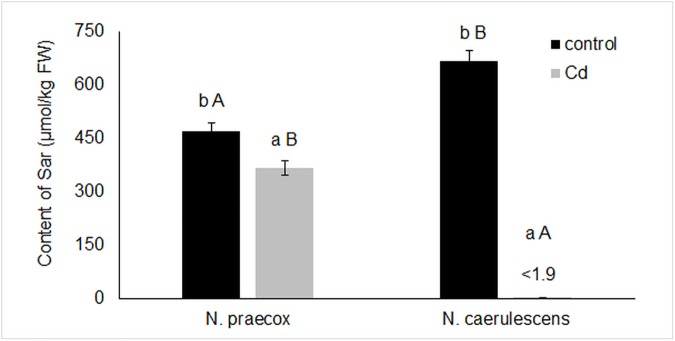
Fig 2. The content of Sar (μmol/kg FW) in the above-ground biomass of plants.
Limit of detection: 1.9 μmol/kg. The values represent the means of data obtained in the experiment (n = 5). Different letters indicate values that are significantly different (p < 0.05): A, B comparison between the two species with the same treatment (growing with or without Cd solution applied to the tested soil); a, b comparison between treatments in each species.

