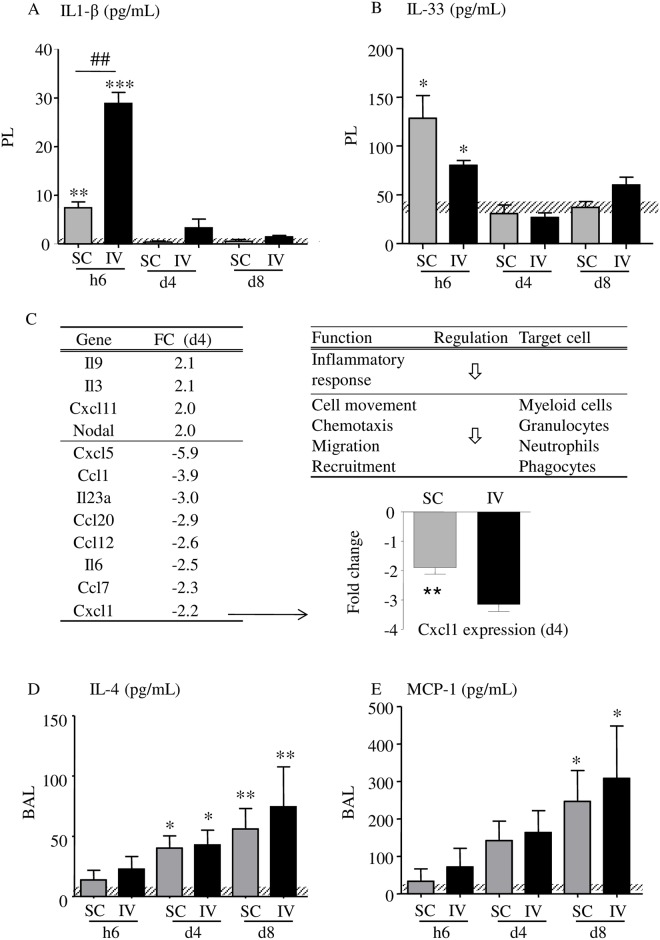
Fig 7. Inflammation and regulation.
Dosage of IL-1β (A) and IL-33 (B) in the pleural fluid (PL) by ELISA, n = 4–8 (pool of 2 independent experiments). Uninfected mice are represented by a dashed horizontal bar. (C) Cytokines/chemokines transcripts (cut-off: >2-fold change, FC) induced in the lung of SC-infected mice at d4 p.i and associated functions. The effects of the gene expression changes in the lung were predicted using Ingenuity Pathways Analysis (IPA); regulation of the functions is indicated by arrows. (D) A q-RTPCR was performed for Cxcl1 transcripts to validate the array results; n = 12 (SC) and 5 (IV). Dosage of IL-4 (D) and MCP-1 (E) in the broncho-alveolar lavage (BAL) by ELISA, n = 5–6. Uninfected mice are represented by a dashed horizontal bar. The results are expressed as mean ± SEM; a two-way ANOVA followed by a Bonferonni was performed for A, B, D and E, *p<0.05, **p<0.01, ***p<0.001 differences between infected mice and naive, ##p<0.01 difference between SC- and IV-infected mice at h6 for IL-1 β; a t-test was performed for Cxcl1, **p<0.01.

