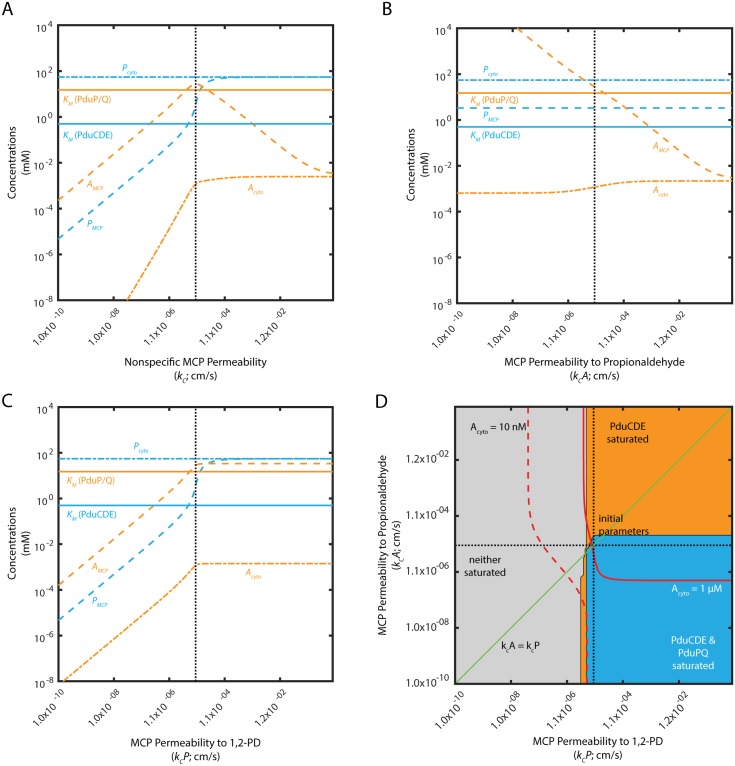
Fig 6. Mean concentrations of 1,2-PD and propionaldehyde in the MCP (PMCP; AMCP) and cytosol (Pcyto; Acyto) as a function of (A) kc when ; (B) when cm/s; and (C) when cm/s. Saturation phase space of PduCDE and PduP/Q with respect to (D) and .
In (A), (B), and (C), KM of PduCDE and PduP/Q are shown as solid lines. The baseline permeabilities are shown with a black dashed line. In (D), regions of saturation (concentration of substrate > KM of the appropriate enzyme) are plotted in blue when PduCDE and PduP/Q are saturated, orange when only PduCDE is saturated, and in grey when neither enzyme is saturated. Red solid lines indicate when Acyto is 1 μM; red dashed lines indicate when Acyto is 10 nM. Black dashed lines indicate the baseline parameter values used in the model of the Pdu MCP. Green line indicates .

