Abstract
Homeostatic systems that rely on genetic regulatory networks are intrinsically limited by the transcriptional response time, which may restrict a cell’s ability to adapt to unanticipated environmental challenges. To bypass this limitation, cells have evolved mechanisms whereby exposure to mild stress increases their resistance to subsequent threats. However, the mechanisms responsible for such adaptive homeostasis remain largely unknown. Here, we used live-cell imaging and microfluidics to investigate the adaptive response of budding yeast to temporally controlled H2O2 stress patterns. We demonstrate that acquisition of tolerance is a systems-level property resulting from nonlinearity of H2O2 scavenging by peroxiredoxins and our study reveals that this regulatory scheme induces a striking hormetic effect of extracellular H2O2 stress on replicative longevity. Our study thus provides a novel quantitative framework bridging the molecular architecture of a cellular homeostatic system to the emergence of nonintuitive adaptive properties.
DOI: http://dx.doi.org/10.7554/eLife.23971.001
Research Organism: S. cerevisiae
eLife digest
Harmful external conditions, such as extreme heat or radiation, can cause stress to cells that may lead to permanent damage and even death. Cell stress is responsible for some cancers and degenerative diseases, and is involved in the process of aging. Cells respond to stress by modifying their activities in order to prevent damage from occurring. Some studies have suggested that the ability of cells to survive a stressful situation might depend both on the severity of the stress and also on the way in which the stress is applied. For example, the stress might start suddenly or develop more gradually.
Cells exposed to a mild level of stress develop a tolerance that enables them to survive stronger doses of the same stress in the future. However, it is not clear how cells acquire such tolerance, and whether mild levels of stress can have more general benefits to cells, such as increased lifespan.
Hydrogen peroxide and other “oxidative” compounds play important roles in cells, but they are also capable of causing damage so their levels must be tightly controlled. Goulev et al. developed a “microfluidic” device to study the effects of oxidative stress on yeast cells. The device made it possible to precisely control the level of hydrogen peroxide in the cells’ environment while monitoring the cells’ stress responses.
The experiments show that exposing yeast cells to gradually increasing levels of hydrogen peroxide can train the cells to be able to survive when they are exposed to high levels of this compound. This ability depends on the activity of specific enzymes called peroxidases that are known to be able to destroy hydrogen peroxide inside the cells. The experiments suggest that gradually increasing levels of hydrogen peroxide trigger increases in the production of peroxidases that protect the cells against future oxidative stress.
Further experiments show that even a very low dose of hydrogen peroxide is sufficient to activate the production of the enzymes, leading to an increase in the lifespan of the cells. A future challenge will be to investigate whether the principles identified in this work also apply to other stress responses in yeast.
Introduction
Homeostatic systems are ubiquitous in biology and function to restore internal physiological variables to a given set point following fluctuations in the internal or external environment. The accuracy of such control mechanisms (i.e. its ability to reach an equilibrium state that is as close as possible to the pre-existing state), is thought to be essential to ensure robust physiological adaptation. Therefore, understanding the mechanisms underlying accurate control in regulatory networks has emerged as a central question in Control Theory applied to biological systems (Khammash, 2016; Ma et al., 2009; Whitacre, 2012). Several seminal studies have pointed to the existence of ‘perfectly adapting’ systems in which exact restoration of the pre-existing state is observed, including bacterial chemotaxis (Barkai and Leibler, 1997; Berg and Tedesco, 1975), calcium signaling (El-Samad et al., 2002), and yeast hyperosmolarity response (Muzzey et al., 2009), all of which are based on a regulatory scheme referred to as ‘integral feedback’ (Yi et al., 2000).
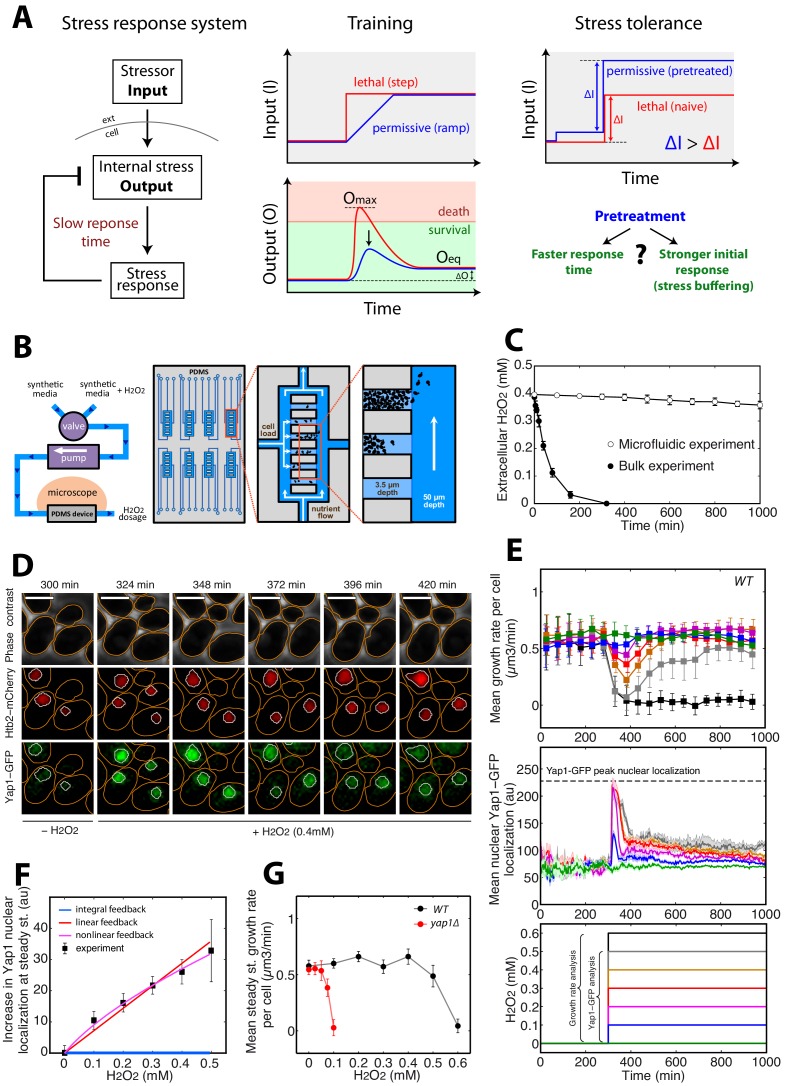
However, high control accuracy alone is insufficient to protect against the potentially damaging effects of environmental challenges, and other dynamical properties of homeostatic systems may determine the cell’s ability to adapt: indeed, most stress regulatory pathways feature transcriptional responses, which are intrinsically slower processes than the other biochemical effects of stress exposure (Muzzey and van Oudenaarden, 2009; Young et al., 2013). Because of this limiting response time, it is expected that a transient peak in the internal stress level (output peak of magnitude Omax, Figure 1A) may occur in response to stepwise exposure to an external stressor (input, Figure 1A). Such a transient overshoot may trigger irreversible deleterious effects leading to cell death, irrespective of the ability of the homeostatic system to accurately restore the pre-existing steady state (Oeq on Figure 1A). In this case, interestingly, the rate at which stress is applied (while keeping constant the overall magnitude of stress) should directly control Omax and hence determine cellular stress resistance (Figure 1A). Remarkably, this hypothesis has neither been formally addressed theoretically nor been tested experimentally. Yet, whether the adaptation range of a homeostatic system is set only by the overall stressor level, or alternatively, depends on the kinetics of the input stress pattern remains a question of fundamental importance.
Figure 1. A single-cell microfluidics assay to monitor yeast adaptation to H2O2.
(A) Schematic representation of ‘training’ and ‘stress tolerance’ phenomena in a simple negative feedback-based system. (B) Schematic of the microfluidic device setup for live-cell imaging in H2O2-containing media. (C) Decline in extracellular H2O2 concentration comparing the single-cell assay and bulk experiment (starting at cellular OD600 = 0.5). (D) Sequence of phase-contrast and fluorescence images of cells at the indicated time points after addition of 0.4 mM H2O2 at t = 300 min. The red and green channels represent the Htb2-mCherry (nuclear marker) and Yap1-GFP signals, respectively. Orange and white lines represent the cellular and nuclear contours obtained after automated segmentation. The white bars represent 5 µm. (E) Top: Mean growth rate per cell as a function of time after addition of different H2O2 concentrations at t = 300 min, as indicated in the bottom panel. Middle: Mean nuclear Yap1-GFP localization as a function of time, with the same color coding as in the top and bottom panels. Yap1-GFP scoring is not possible at 0.6 mM due to metabolic arrest/cell death and GFP signal decline. (F) Increase in mean Yap1-GFP localization (relative to the pre-stress level) at steady state (measured for t > 800 min) as a function of H2O2 concentration added at t = 300 min during a step experiment. Lines represent the best fits to mathematical models of integral (blue), linear (red) and nonlinear (magenta) feedback with different sets of assumptions (see Materials and methods). (G) Comparison of growth rate at steady state as a function of H2O2 concentration for the wild-type (WT) strain and the Δyap1 mutant. Error bars and shaded regions are SEM (C, N = 6; E, N > 100 for most time points; F and G, N > 100 for each H2O2 concentration). See also Figure 1—figure supplement 1 and Materials and methods.
Figure 1—figure supplement 1. Medium diffusion properties in the microfluidics device.
Figure 1—figure supplement 2. Principle of growth rate measurements.
Interestingly, however, there is one prominent example of stress pattern that confers improved cellular adaptation despite fast environmental changes, known as acquired stress resistance, or stress tolerance: in this case, a mild stress preconditioning increases resistance to subsequent, acute exposure to large doses of the same stressor. This effect has been observed in a broad spectrum of species, from unicellular organisms to mammals, in response to diverse environmental challenges (Davies et al., 1995; Hecker et al., 2007; Kandror et al., 2004; Kensler et al., 2007; Lewis et al., 1995; Lindquist, 1986; Lou and Yousef, 1997; Lu et al., 1993; Scholz et al., 2005) and is considered to be an anticipation strategy to overcome potentially harmful environmental conditions in the future (Mitchell et al., 2009). Stress resistance is thus itself an adaptive trait reflecting an intrinsic plasticity of the homeostatic machinery. However, the mechanisms underlying such adaptive homeostasis- the robustness of which is improved following stress exposure (Davies, 2016), remain to be elucidated. In particular, it is not known how this acquired stress resistance bypasses/overcomes the intrinsically slow response time of the stress response (e.g. through faster transcriptional response, or initially higher stressor degradation rate- analogous to stress buffering) and how this might be mechanistically achieved (Figure 1A).
Here, we used the response of budding yeast to hydrogen peroxide (H2O2) stress as a model system to investigate the driving principles that govern the adaptation to arbitrary stress patterns and to decipher the mechanisms at work in adaptive homeostasis. We developed a quantitative framework based on mathematical modeling, live-cell imaging, and microfluidics to apply controlled H2O2 stress patterns and to measure the adaptive stress response with a high level of accuracy. We demonstrate that cell survival is highly stress-rate dependent, validating the paradigm that adaptation is limited by the response time of the cellular homeostatic machinery and thus revealing an unprecedented ‘trainability’ of the cells to stress. We also show that the acquisition of stress resistance is distinct from cellular training and originates in the nonlinear scavenging of H2O2 by peroxiredoxins (Prx). Along with this, our study unravels an important Prx-dependent replicative lifespan extension in the presence of very low doses of H2O2. This reveals an unprecedented direct hormetic effect that can be quantitatively accounted for by the nonlinear Prx feedback model. Our study provides the first quantitative and mechanistic analysis that establishes the link between the architecture of a fundamental stress homeostatic system and the emergence of distinct nonintuitive properties, namely cellular training to stress and adaptive homeostasis.
Results
A quantitative assay to measure adaptation to H2O2 stress in single dividing yeast cells
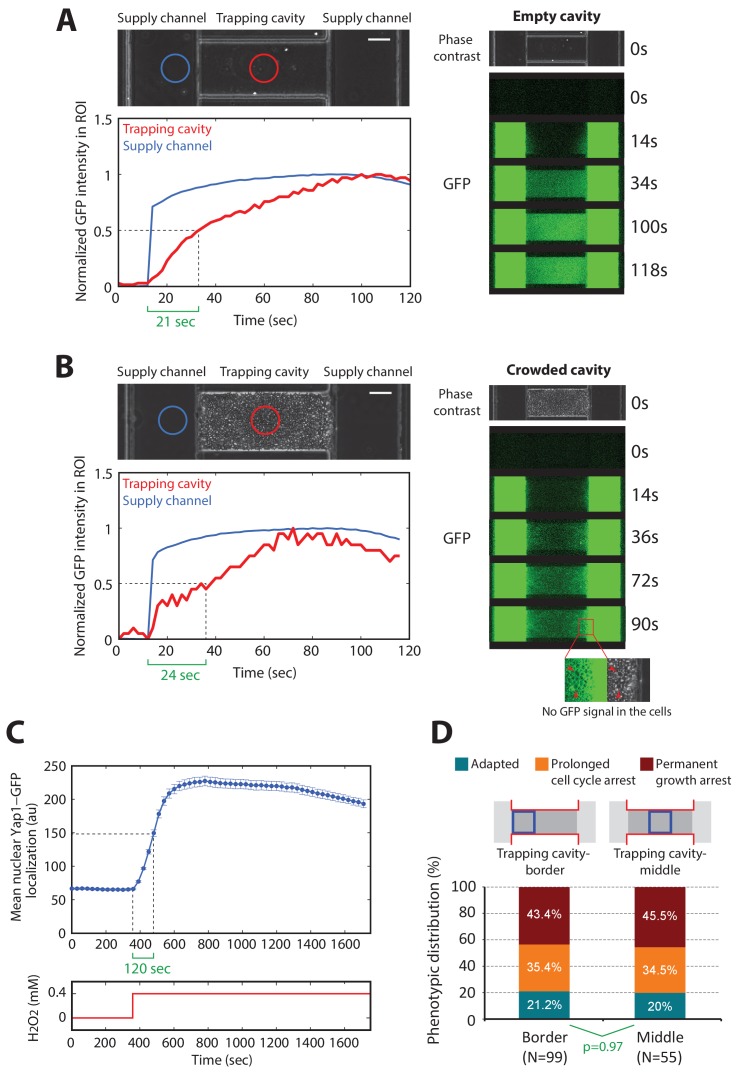
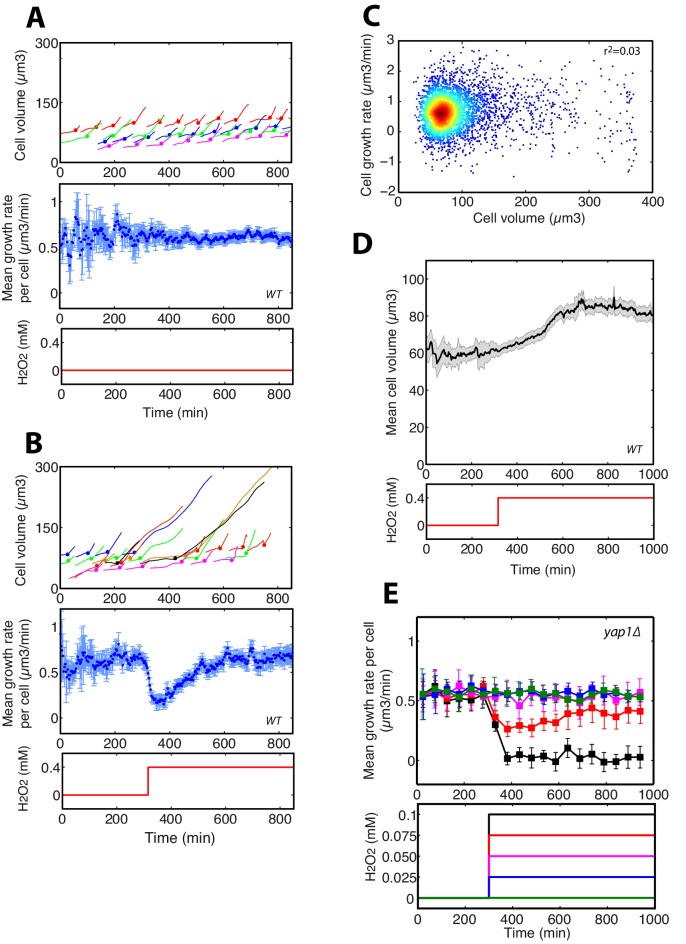
We first sought to characterize the kinetics of the cellular response to stepwise exposure to increasing H2O2 concentrations and the emergence of cellular adaptation. Adaptation to H2O2 is usually measured by quantifying the fraction of surviving cells after the addition of a bolus of H2O2 to cells in culture. Under these conditions, cells rapidly degrade the H2O2 in the medium and, therefore, adaptation is partly due to the removal of the stressor. To circumvent this problem and to allow precise control of the stressor level, we developed custom microfluidic device to monitor the divisions of individual cells in trapping cavities while controlling external H2O2 concentrations by continuous replenishment of H2O2-containing medium (Figure 1B and C and Materials and methods). Using a fluorescent dye, we checked that diffusion in the trapping cavities was not impaired by the presence of a large cell cluster in the cavity (Figure 1—figure supplement 1A and B) and we also verified that cell growth was not affected despite the increasing cell confinement during a typical experiment (up to 1000 min, see Figure 1—figure supplement 2A). Using this technique, therefore, we could follow cellular adaptation by monitoring activation of the H2O2 stress response and real-time cellular growth rate.
The signaling network activated in response to H2O2 is centered on the Yap1 regulon (Kuge and Jones, 1994; Lee et al., 1999). Yap1 is a transcription factor that, in the absence of H2O2, shuttles between the cytoplasm and nucleus. Upon exposure to H2O2, Yap1 is oxidized and nuclear export is prevented (Azevedo et al., 2003; Kuge et al., 1997; Lee et al., 1999). Hence, nuclear accumulation of Yap1 is a sensitive reporter of internal H2O2 levels (Toledano et al., 2004). In the nucleus, Yap1 activates the expression of genes involved in redox homeostasis and H2O2 scavenging (Gasch et al., 2000; Godon et al., 1998; Lee et al., 1999), leading to a negative feedback regulatory loop (Toledano et al., 2004). We monitored the dynamics of individual cells expressing Yap1-GFP and a nuclear marker (histone Htb2-mCherry) with a 3-min interval. Following the switch to medium containing 0–0.4 mM H2O2 (at t = 300 min; Figure 1D and Video 1), the cells experienced a transient stress level-dependent reduction in growth rate (see Materials and methods for the principle of the measurement) followed by a complete recovery, revealing intrinsic cellular adaptation (Figure 1E). In parallel, the switch to H2O2 induced an abrupt burst in Yap1-GFP nuclear localization, which saturated above 0.2 mM H2O2. Similar experiments performed with higher temporal resolution (30 s interval) revealed that the nuclear relocation time is around 120 s (see Figure 1—figure supplement 1C), which is much faster that the overall adaptation timescale (~45–100 min, see Figure 1E: Yap1-GFP quantification). However, this stands significantly higher than the timescale of stressor diffusion across cavity (see Figure 1—figure supplement 1A and B), therefore revealing that the activation of Yap1 is set by the diffusion of the stressor across the cell membrane rather than by limited diffusion in the device.
Video 1. Growth rate monitoring upon H2O2 stress (refers to Figure 1).
Movie showing a time-lapse experiment where cells are exposed to sudden step stress of 0.4 mM H2O2 at t = 300 min. Left: phase contrast, right: growth rate evolution graph. The white bar represents 5 µm.
The burst of nuclear Yap1-GFP relocation was followed by partial recovery to a steady-state level that was also H2O2 concentration-dependent (Figure 1D–F and Video 2), suggesting that Yap1 activity is still required in the adapted state (i.e. following growth recovery). Consistent with this, deletion of Yap1 strongly decreased the cells’ capacity to adapt, in agreement with previous findings (Inoue et al., 1999) (Figure 1G and Figure 1—figure supplement 2E). Last, the fact that a 0.1 mM H2O2 stress induces a partial nuclear relocation of Yap1-GFP but has no effect on growth rate indicates that Yap1 signaling is more sensitive to H2O2 than is the overall cellular physiology (Figure 1E).
Video 2. Yap1 nuclear relocation upon H2O2 stress (refers to Figure 1).
Movie showing the nuclear enrichment of Yap1 in cells exposed to 0.4 mM H2O2 at t = 300 min. Left: Phase contrast and mCherry (Htb2-mCherry) channels. Right: GFP (Yap1-GFP) channel. The white bar represents 5 µm.
H2O2 effects on physiology are mediated by sequential thresholds
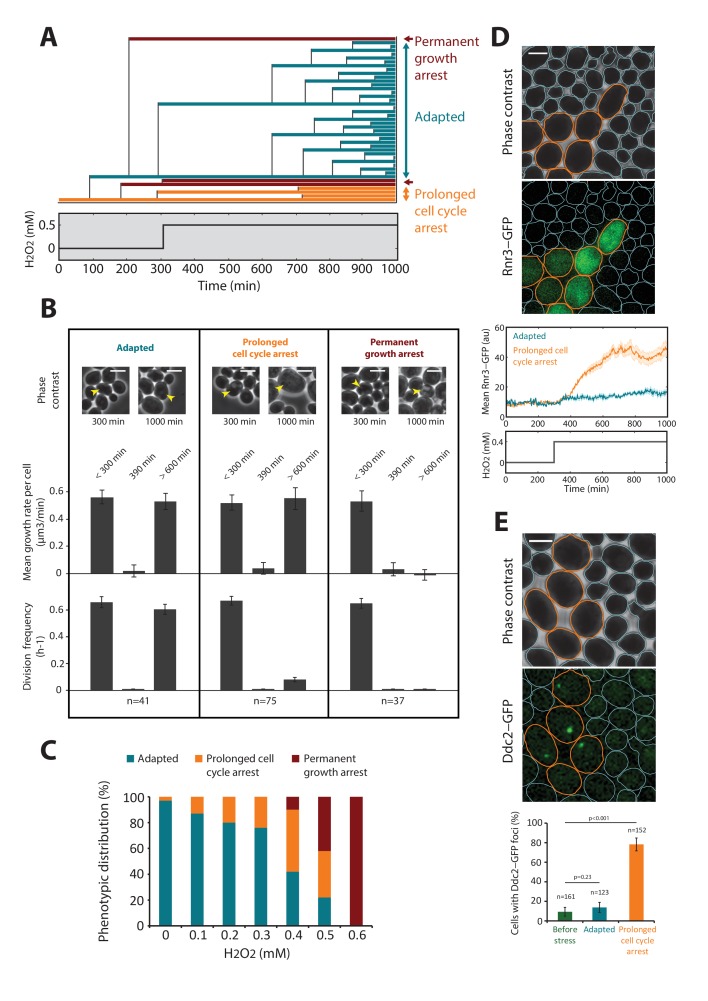
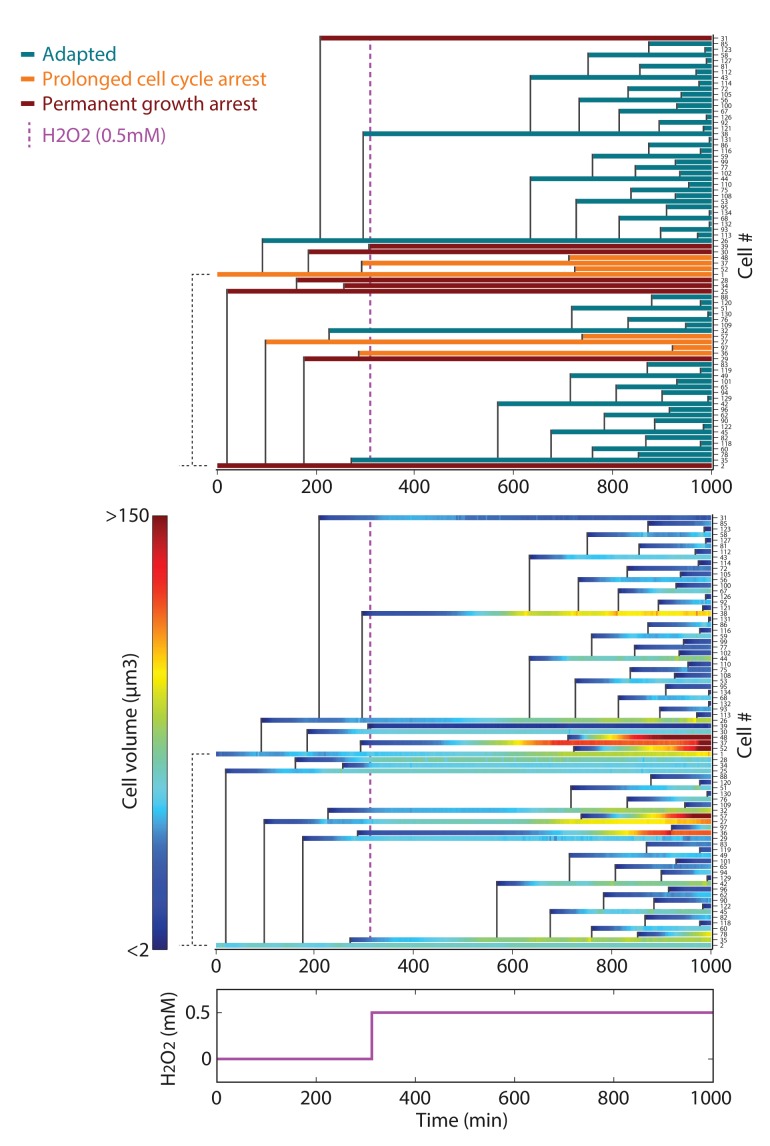
Interestingly, while the cells adapted to 0.3 mM H2O2 (complete mean growth rate recovery), exposure to 0.6 mM H2O2 induced full growth arrest (Figure 1E and Video 3), revealing that cell fate is controlled by a sharp threshold in external H2O2 level. To determine the physiological changes accompanying this switch from adaptation to arrest, we focused on the behavior of individual cells exposed to a sublethal dose (0.5 mM) of H2O2 (see Figure 2A and B). Notably, while all cells experienced at least a transient growth arrest (at t = 390 min, Figure 2B) following exposure to the stressor (at t = 300 min), we observed a high degree of heterogeneity in cell fate across the population at steady-state: 22% of cells present at the time of H2O2 addition recovered a normal growth and division rate at t > 600 min (referred to as the ‘adapted’ phenotype in the following); 36% experienced a prolonged slow-down of cell cycle progression characterized by an extended budded period, but continued to increase in size over time (‘prolonged cell cycle arrest’ phenotype); and 42% stopped growing and failed to divide (‘permanent growth arrest’ phenotype) (Figure 2A–C and Figure 2—figure supplement 1 and Video 4). We checked this heterogeneity in cell fate was not dependent on the position of cells with respect to the border of the cavity (see Figure 1—figure supplement 1D). Interestingly, performing the same analysis of phenotypic distribution at various H2O2 levels revealed that the cell cycle arrest phenotype emerged at lower concentrations of H2O2 than the growth arrest phenotype (typically ~0.2 and 0.5 mM H2O2, respectively; Figure 2C).
Video 3. Cell metabolic arrest at high H2O2 dose (refers to Figure 1).
Movie showing a permanent cell growth arrest in cells exposed to 0.6 mM H2O2. Left: phase contrast, right: growth rate evolution graph. The white bar represents 5 µm.
Video 4. Phenotypic variability upon H2O2 stress (refers to Figure 2).
Movie showing different cell fates in cells exposed to 0.5 mM H2O2 at t = 300 min. Blue cell contours: Adapted cells; Yellow cell contours: Prolonged cell cycle arrest; Red contours: Permanent growth arrest. The white bar represents 5 µm.
Figure 2. DNA damage checkpoint and metabolic arrest during exposure to H2O2.
(A) Lineage of cells after addition of 0.5 mM H2O2 at t = 300 min. Each colored line corresponds to a single cell, and cell budding is indicated by the vertical black lines. The plot shows examples of cells with three distinct growth phenotypes, as indicated. (B) Quantification of the growth rate and division rate of the cellular phenotypes displayed in (A). Error bars are SEM. (C) Relative distribution (%) of cellular phenotypes as a function of H2O2 concentration added at t = 300 min. N = 100 for each concentration. (D) Top: Upregulation of cytoplasmic Rnr3-GFP expression at 300 min after addition of 0.4 mM H2O2. Bottom: Quantification of the Rnr3-GFP signal after addition of 0.4 mM H2O2. (E) Top: Upregulation of Ddc2-GFP expression at 300 min after addition of 0.4 mM H2O2. Bottom: Percentage of cells with durable Ddc2-GFP foci measured before and at 300 min after addition of 0.4 mM H2O2 for the cell phenotypes identified in (A). Error bars are 95% confidence intervals (CI). Two-proportions Z test. The whites bar represent 5 µm. See also Figure 2—figure supplement 1.
Figure 2—figure supplement 1. Lineage of cells following the exposure to 0.5 mM H2O2.
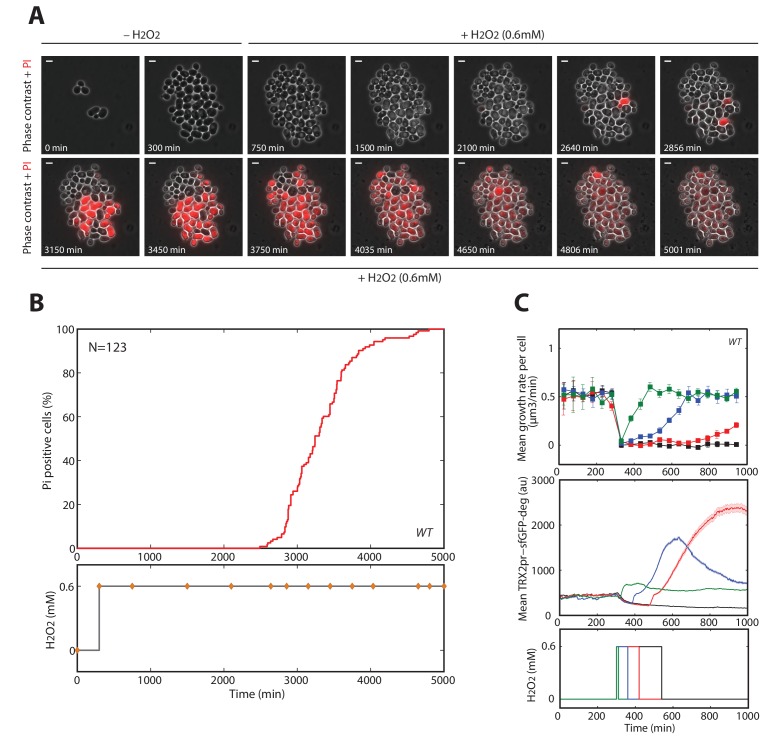
Figure 2—figure supplement 2. Cell death quantification during high (0.6 mM H2O2) step stress.
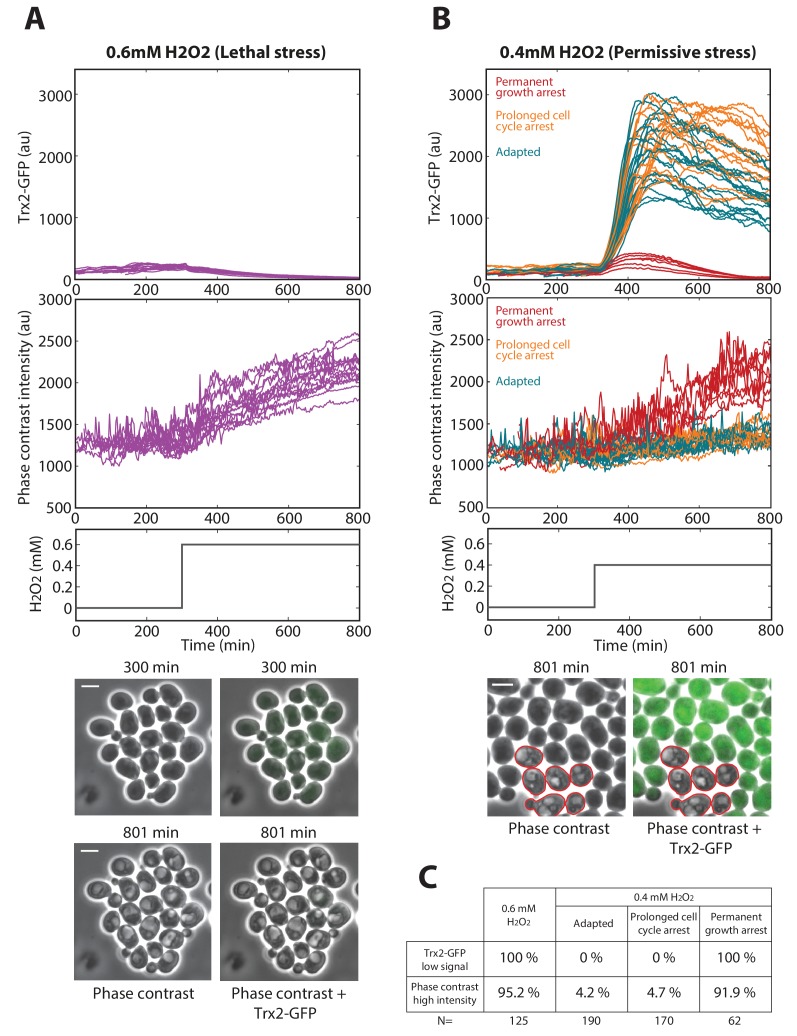
Figure 2—figure supplement 3. Cell death markers for mild (0.4 mM H2O2) step stress.
To go beyond the characterization of growth and division impairments in cells submitted to H2O2, we asked whether these defects were accompanied by the activation of DNA damage response and/or ultimately lead to cell death. To this end, we examined the response of cells expressing Rnr3-GFP or Ddc2-GFP fusion proteins. Rnr3 is a subunit of ribonucleotide reductase and is upregulated during the DNA damage response (DDR), and Ddc2 is a DNA damage checkpoint protein that forms foci upon recruitment to DNA lesions. Exposure to 0.4 mM H2O2 substantially increased cytoplasmic Rnr3-GFP levels in cells displaying the prolonged cell cycle arrest phenotype, but not in adapted cells (Figure 2D). Similarly, the vast majority of cell-cycle-arrested cells displayed bright foci of Ddc2-GFP fluorescence, unlike adapted cells (Figure 2E). These experiments indicated that H2O2-induced DNA damage and subsequent DDR checkpoint activation were responsible for prolonged cell cycle arrest. In contrast, cells experiencing a permanent arrest showed no detectable increase in Rnr3-GFP (not shown). We considered that these cells may have a compromised physiological state preventing any response to the oxidative stress threat, and may ultimately die. To test this hypothesis, first, we used a vital stain (propidium iodide, PI) to monitor the onset of death in cells abruptly exposed to 0.6 mM H2O2 (see Figure 2—figure supplement 2A and B and Video 5). We found that all cells (N = 123) eventually became fluorescent, therefore demonstrating that a stress exposure to this H2O2 concentration ultimately induces cell lysis. Next, we wondered to which extent this growth arrest phenotype could be reverted by stress removal. To this end, we monitored the mean growth rate and the expression of the thioredoxin promoter fused to both sfGFP and a destabilizing degron sequence, TRX2pr-sfGFP-deg (TRX2 encodes a Yap1-regulated thioredoxin), after exposure of cells to 0.6 mM H2O2 for varying periods. H2O2 addition induced rapid growth arrest and irreversible decay of TRX2pr-sfGFP-deg levels (black lines on Figure 2—figure supplement 2C upper and middle panels, respectively). However, removal of the stress by switching back to H2O2-free medium at various times after H2O2 addition led to recovery of the mean cellular growth rate and induced reactivation of the Yap1 regulon if the duration of exposure was less than 4 hr (Figure 2—figure supplement 2C). This indicated that a few hours of exposure at 0.6 mM H2O2 were necessary to induce an irreversible growth arrest phenotype that ultimately lead to cell death.
Video 5. Cell mortality at high H2O2 step stress (refers to Figure 2—figure supplement 2).
Movie showing the incorporation of PI in cells exposed to 0.6 mM H2O2 at t = 300 min. The white bar represents 5 µm.
Last, we checked that the behavior of permanently arrested cells, even at sublethal H2O2 concentrations (0.4 mM H2O2), was similar to the irreversible growth arrest phenotype at 0.6 mM H2O2. For this, we compared the expression of the TRX2-GFP fusion protein following either a 0.4 mM or a 0.6 mM H2O2 step. In both cases, we observed that the subpopulation of permanently arrested cells showed very low TRX2-GFP levels (Figure 2—figure supplement 3A–C). In addition, we found that, unlike adapted and cell cycle arrested cells, cells with a permanent growth arrest displayed the same bright and large vacuole phenotype (Figure 2—figure supplement 3A–C) in both conditions (0.4 mM and 0.6 mM H2O2). Therefore, these results indicate that the permanent growth arrest phenotype observed in step experiments (lethal or sublethal) reflects the inability of the cells to defend against the stressor.
Collectively, our analysis reveals the existence of distinct cell fates following the exposure to acute sublethal doses of H2O2, and demonstrates that these phenotypes occur in a H2O2 concentration-dependent manner.
The kinetics of temporal stress patterns controls cellular adaptation to H2O2 through a training mechanism
The observation that increasing H2O2 external levels resulted in a sharp and partially reversible transition from adaptation to growth arrest suggested that the transient internal stress level Hmax reached closely after exposure to H2O2 may exceed a toxic concentration Htox beyond which cellular function is impaired, as hypothesized in the introduction. If so, exposure of cells to a gradual increase in H2O2 concentration should allow the cells more time to activate the antioxidant response and should thus dramatically improve cellular adaptation (see Figure 1A). To understand quantitatively how the kinetics of a stress pattern may influence cellular adaptation, we first developed a mathematical description of the homeostatic machinery based on the negative feedback regulation in the Yap1 network. This model was then used throughout this study to help identify and formalize the emergent properties of this system through iterative cycles of predictions and experimental challenges, rather than to perform exhaustive data fitting aimed at retrieving individual parameter values.
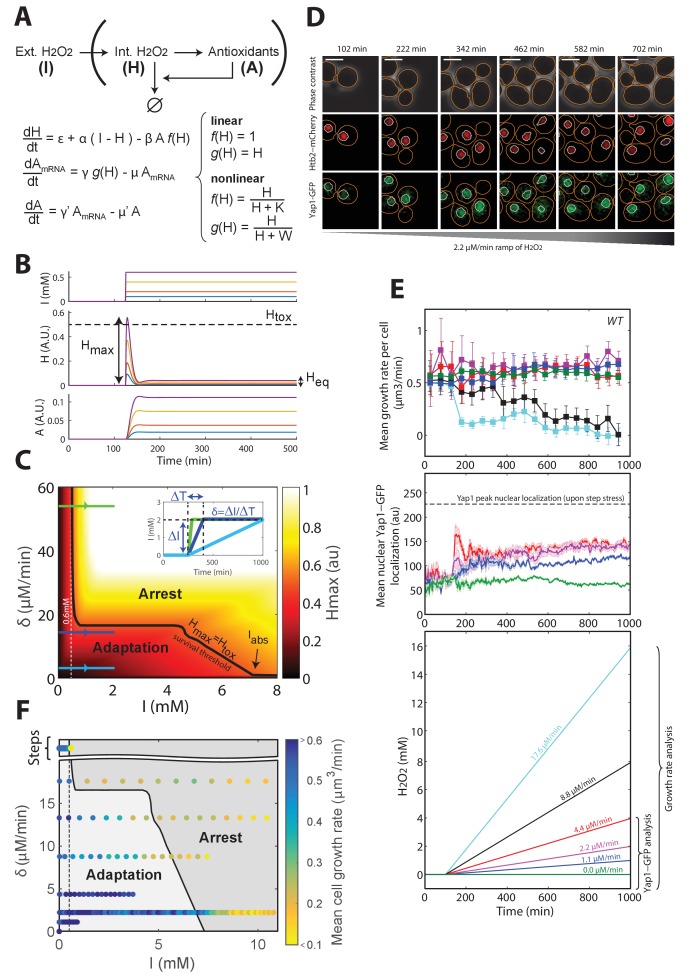
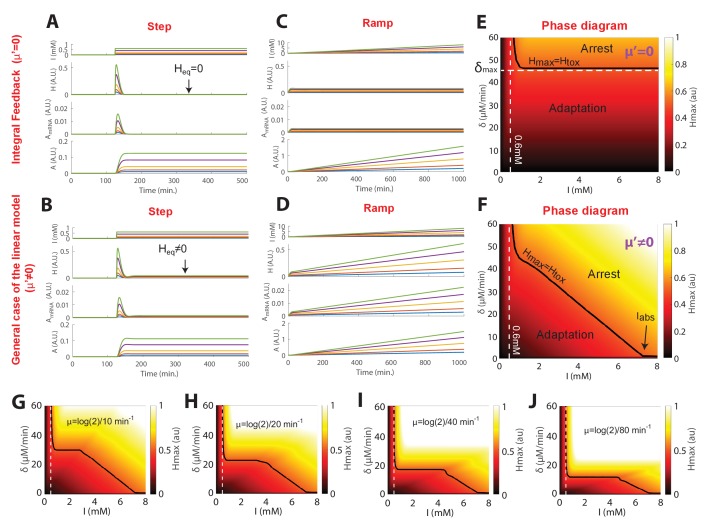
The model assumed that nuclear relocation of Yap1 increases the production of antioxidants (referred to as ‘A’ in the model, see Figure 3A), which then scavenge intracellular H2O2 (‘H’ in Figure 3A). For the sake of simplicity, we first developed a linear version of this model (f(H)=1 and g(H) = H; Figure 3A) that could successfully recapitulate the limited accuracy of the homeostatic system; the internal H2O2 level at steady-state Heq increases with the magnitude of H2O2 steps, unlike a system based on an ‘integral’ feedback regulatory scheme (Figures 1E, F and 3B, and Materials and methods). This property is a direct consequence of the assumption that antioxidants are not infinitely stable but must be diluted in growing cells (μ’≠0, see Materials and methods and Figure 3—figure supplement 1A and B). However, the growth rate does not affect the kinetics of the internal H2O2 burst during the transient response to H2O2 steps (see Figure 3—figure supplement 1 and Materials and methods). Therefore, the observation that the growth rate undergoes a transient slowdown during the regime that precedes adaptation to sublethal H2O2 steps should not impact the overall internal H2O2 kinetics nor the cellular adaptation capacity. Therefore, for the sake of simplicity, we neglected the variations in growth rate in the model.
Figure 3. A negative feedback-based model to describe adaptation to H2O2.
(A) Schematic of the regulatory network involved in H2O2 scavenging: external H2O2 (represented by I), internal H2O2 (represented by H), and antioxidants (represented by A). A linear set of differential equations is used to describe the evolution of this system over time. (B) Response of the linear system described in panel (A) to sudden exposure to external H2O2 (step of amplitude I). Each colored line corresponds to a given concentration of H2O2. Heq is the steady-state internal H concentration, Hmax is the maximum H concentration reached during the transient regime. Htox is the threshold concentration beyond which growth/division is assumed to stop (obtained for I = 0.6 mM). (C) Phase diagram showing Hmax as a function of the amplitude of the step I and the rate of the H2O2 ramp δ = ΔI/ΔT. Inset shows a graphical representation of these parameters. The solid black line indicates the contour given when Hmax = Htox, assuming the general assumptions of the linear model described in panel A. (D) Sequence of phase-contrast and fluorescence images of individual cells at the indicated times after initiation (t = 100 min) of a linear ramped increase in H2O2 concentration at a rate δ of 2.2 μM/min. The red and green channels represent the Htb2-mCherry and Yap1-GFP signals, respectively. The white bars represent 5 µm. (E) Top: Mean growth rate per cell as a function of time after initiation (t = 100 min) of linear ramps in H2O2 concentration. The line colors correspond to the indicated ramp slopes in the bottom panel. Middle: Mean nuclear Yap1-GFP localization. Error bars and shaded regions are SEM, N > 100 for most time points. (F) Phase diagram recapitulating the mean growth rate of cells during adaptation to steps (Figure 1E) and linear ramps at various rates δ. The gray shading delimits the regions of adaptation and arrest, as expected from the linear feedback model. See also Figure 3—figure supplement 1 and Materials and methods.
Figure 3—figure supplement 1. Linear model: response to step, ramps, and training capabilities.
Figure 3—figure supplement 2. Experimental setup to generate H2O2ramps and scoring of the permanent growth arrest phenotype.
Importantly, the linear model also predicted that, whereas steep ramps would quickly lead to growth arrest (since, eventually Hmax > Htox; green line on Figure 3C and inset), as observed experimentally beyond 0.6 mM, slower stress ramps may allow the cells to adapt to much higher stress levels (keeping Hmax < Htox; blue lines on Figure 3C and inset). The phase diagram in the (δ, I) space recapitulated these predictions and, additionally, clearly delimited the region in which adaptation to high-stress magnitude I is permitted (indicated by the black line Hmax = Htox on Figure 3C). The extent of this region is limited by the overall accuracy of the homeostatic system, which is mostly set by the degradation rate μ’ of antioxidant enzymes (Figure 3—figure supplement 1E and F and Materials and methods) and the response time of the antioxidant system, which derives from the degradation rate μ of corresponding mRNAs (Figure 3—figure supplement 1G–J and Materials and methods); μ was set to log(2)/40 min−1, according to previous measurements (Geisberg et al., 2014).
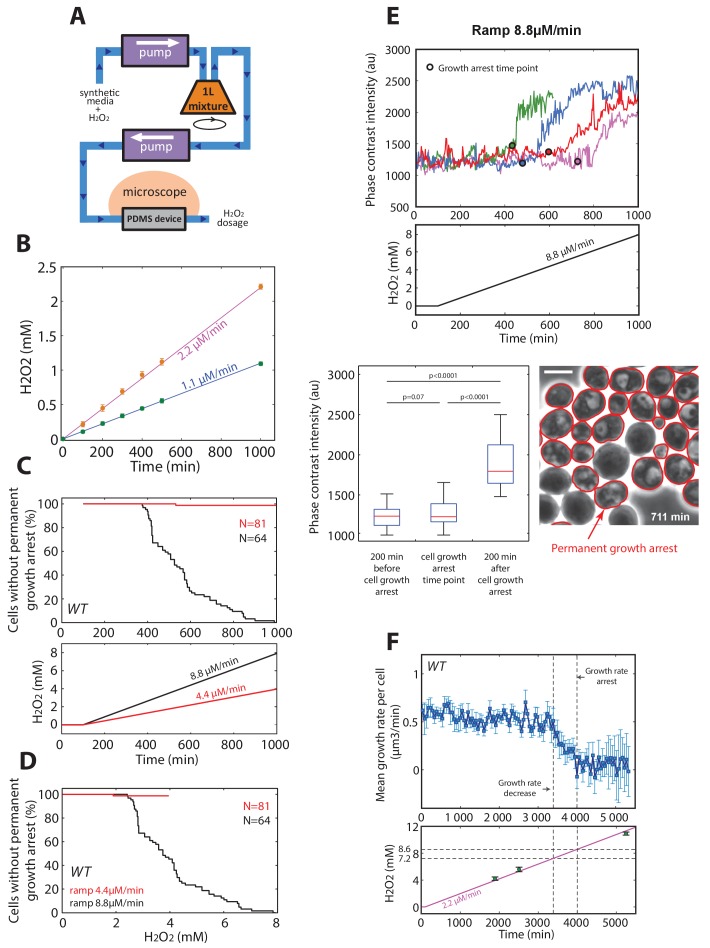
To test the prediction of the linear model, we developed a protocol to generate a linear increase in H2O2 concentration over time in the microfluidic chip, with rates from 1.1 μM/min to 17.6 μM/min (Figure 3—figure supplement 2A and B and Materials and methods). Under these conditions, we observed no decline in growth rate up to >4 mM H2O2 when the slope δ was ≤4.4 μM/min (Figure 3D and E), whereas the growth rate decreased progressively at δ ≥8.8 μM/min (Figure 3E). We checked that this decay in growth rate observed at the population level mainly resulted from a progressively increasing number of individual cells undergoing a permanent growth arrest, consistently with the phenotype described in step experiments (Figure 3—figure supplement 2C). Similarly, these arresting cells displayed a high-phase-contrast intensity due to large vacuoles, suggesting that these cells are unable to adapt and ultimately die (Figure 3—figure supplement 2E). In addition, we verified that the growth rate decay was not due to the higher absolute H2O2 concentration reached during a 8.8 μM/min ramping experiment compared to a ramp of 4.4 μM/min. Indeed, we observed that the onset of occurrence of the growth arrest phenotype at 8.8 μM/min occurred at a lower H2O2 level that the one reached at 4.4 μM/min, whereby no growth arrest was observed (Figure 3—figure supplement 2D). Altogether, these results confirmed the prediction of the model that adaptation is strongly stress-rate dependent and validated the hypothesis that the transient internal H2O2 peak level reached with stepwise addition limits the ability to adapt. In agreement with this, nuclear localization of Yap1 was lower during ramping (Figure 3E) than during the step experiments (Figure 1E).
Interestingly, the model also predicted the existence of an absolute H2O2 level Iabs beyond which no adaptation is possible, even with extremely slow ramping, due to the dilution of antioxidants (Figure 3C, Figure 3—figure supplement 1, and Materials and methods). To estimate this threshold experimentally, we monitored the growth rate of cells upon exposure to a slow H2O2 ramp (δ = 2.2 μM/min) for >5000 min and found that the onset of growth decline occurred at a H2O2 concentration of 7.2 mM (Figure 3—figure supplement 2F). From a theoretical viewpoint, this concentration is a fundamental constant that characterizes the overall buffering capability of the homeostatic system and integrates most of the parameters of the model (see Materials and methods). Based on this estimate, combining all step and ramp experiments in the (δ, I) phase space (using growth rate as a readout of adaptation) provided good agreement between the experiments and the model (Figure 3C and F).
Overall, this analysis identified a > 10-fold increase in the H2O2 adaptation limit observed when using slow versus fast stress ramping, which could be explained by a linear negative feedback model in which the response time of antioxidant expression plays a critical role. The unprecedented analysis therefore revealed the ‘training’ capabilities of individual yeast cells, which can be progressively acclimated to increasingly high levels of stress.
Acquisition of tolerance to H2O2 is distinct from cellular training
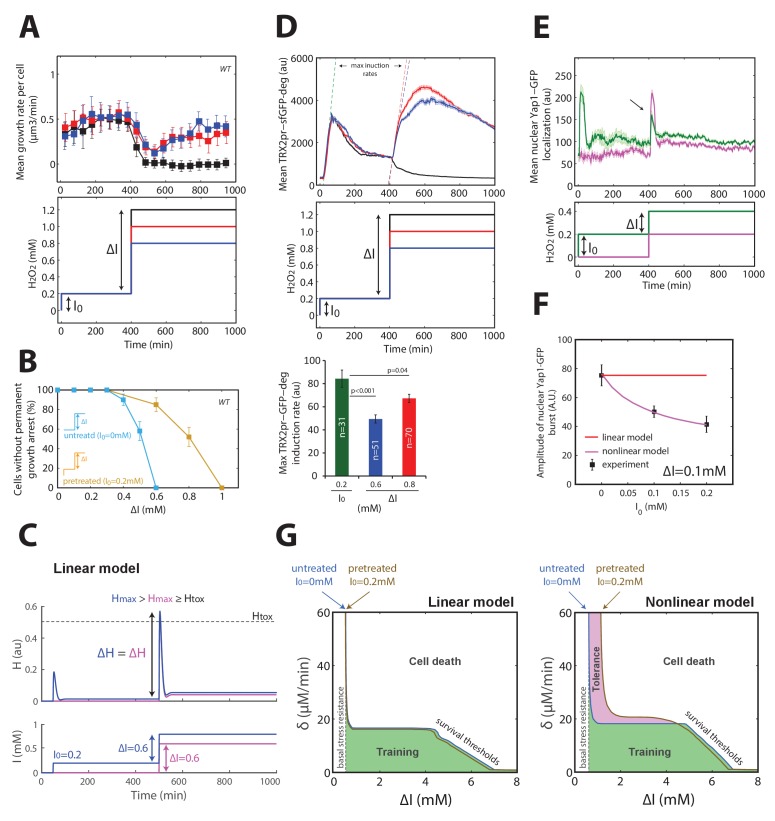
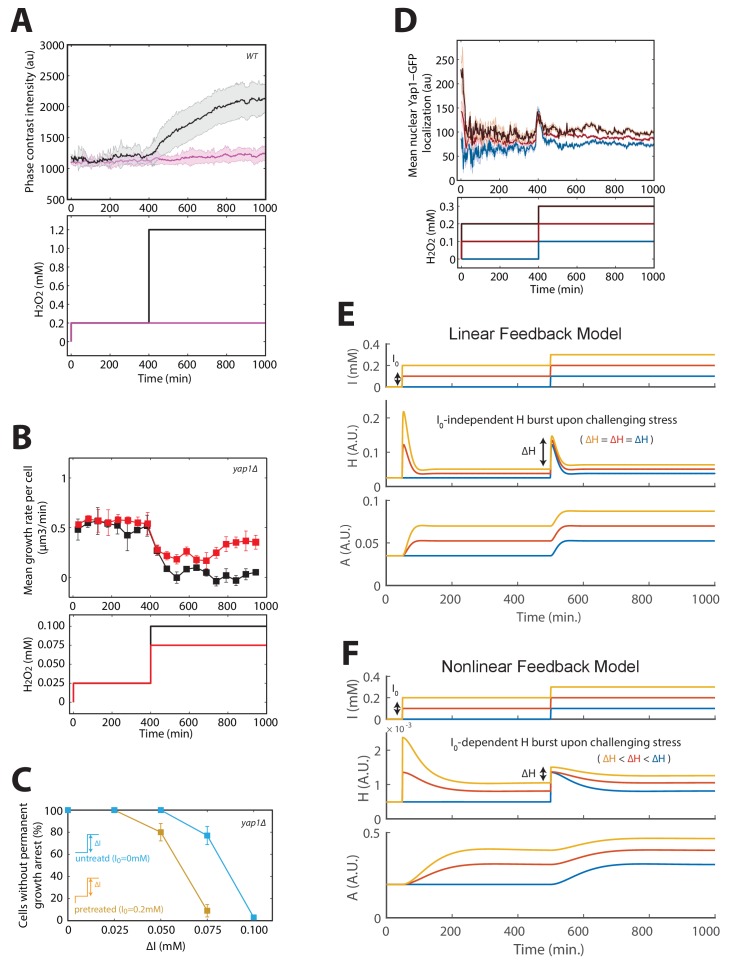
Next, we considered how our framework based on a linear feedback model could explain the phenomenon of acquired stress tolerance, in which mild (I0 = 0.1–0.4 mM) H2O2 pretreatment increased by several orders of magnitude the fraction of cells surviving a subsequent challenge with a more severe stepwise stress of magnitude ΔI (Davies et al., 1995). To transpose these observations using our methodology, we first verified that pretreating cells with I0 = 0.2 mM H2O2 shifted the adaptation threshold to ΔI = 1 mM (Figure 4A and B), contrasting with the ΔI = 0.6 mM threshold obtained for I0 = 0 mM (as shown in Figure 1). Here again, the large vacuole phenotype obtained with ΔI = 1 mM (as measured using phase-contrast intensity of cells) strongly suggested that these permanently arrested cells failed to adapt, as in steps and ramp experiments (Figure 4—figure supplement 1A). In addition, we found that this effect was clearly dependent on the Yap1 regulon, since yap1Δ mutants did not display acquisition of tolerance (Figure 4—figure supplement 1B and C). However, this increased resistance to stepwise stress exposure could not be explained by the linear feedback model, which predicted that both pretreated and naive cells should experience a similar internal peak stress during the subsequent stress challenge (Figure 4C). Mathematically, this results from an additivity principle, according to which the response to a perturbation ΔH (i.e. stress challenge) is independent of the response triggered by a preceding input fluctuation (i.e. preconditioning).
Figure 4. Mechanism of acquisition of tolerance to stress.
(A) Mean cell growth rate (top panel) of cells exposed to H2O2 steps of the magnitude indicated in the bottom panel at t = 400 min after a 0.2 mM pretreatment at t = 0 min. (B) Fraction of cells without permanent growth arrest at different concentrations of H2O2 in the presence (yellow) or absence (blue) of pretreatment. N = 100 for each concentration. (C) Response of the linear system to simple H2O2 step of amplitude ΔI = 0.6 mM for naive (magenta: I0 = 0 mM) or pretreated (bleu: I0 = 0.2 mM) cells. (D) Top: Mean cell transcriptional dynamics (top panel) of the TRX2 promoter (Trx2-sfGFP-degron) for the H2O2 treatments shown in the middle panel. Bottom: Quantification of the maximum transcription rate of the TRX2 promoter during the indicated steps. Two-means Z test. (E) Mean cell Yap1-GFP nuclear localization upon a 0.2 mM H2O2 step for cells with (green line) or without (magenta line) a 0.2 mM pretreatment, as indicated in the bottom panel. (F) Quantification of the amplitude of the burst in Yap1 nuclear localization during a 0.1 mM H2O2 challenge step. The lines indicate the fit of the linear (red) and nonlinear (magenta) models. (G) Numerical phase diagram indicating the region in which adaptation is permitted as a function of the overall stress magnitude ΔI and stress rate δ for the linear (left) and nonlinear (right) models. The solid black line indicates the contour given when Hmax = Htox (survival threshold) as in Figure 3C. The vertical dashed line represents the basal stress resistance, as observed in step experiments. The green color represents the region in which cells can be trained to resist higher stress levels through a slow ramping process. The magenta region highlights the shift in survival threshold obtained following a pretreatment according to the nonlinear model. A, D–F, error bars and shaded regions are SEM (N > 100 for most time points). B, error bars are 95% CI. See also Figure 4—figure supplement 1.
Figure 4—figure supplement 1. Acquisition of tolerance: comparison of the linear and nonlinear models.
To explain this phenomenon of acquired stress tolerance, we first hypothesized that the pretreatment may switch the cell to an activated/adapted state capable of a much quicker transcriptional response to the subsequent challenge, as proposed previously in the context of salt cross-tolerance (Guan et al., 2012). To test this hypothesis, we monitored the rate of TRX2pr-GFP-deg accumulation upon exposure to a range of H2O2 steps and found a lower transcription rate of the TRX2 promoter during the challenging step of magnitude ΔI = 0.6–0.8 mM than during the pretreatment of magnitude I0 = 0.2 mM (Figure 4D), thus ruling out the hypothesis of quicker and/or stronger transcriptional reactivation of the homeostatic machinery.
As an alternative hypothesis, we reasoned that stress preconditioning might increase the H2O2-buffering efficiency (through higher scavenging rate) leading to a lower transient internal H2O2 level upon exposure to the subsequent stress challenge. In line with this, we found that the amplitude of the burst in Yap1 nuclear relocation decreased as a function of the pretreatment level I0 (Figure 4E and F, and Figure 4—figure supplement 1D), consistent with the lower transcriptional activation of its effector gene TRX2. This indicated that the pretreated cells perceive a lower internal stress level than do naive cells.
To quantitatively account for these observations, we sought to refine the mathematical description of the homeostatic system. According to the linear model, the scavenging rate depends only on the concentration of antioxidant enzymes A, meaning that H2O2-scavenging enzymes would always be saturated by the H2O2 substrate following stress exposure. If, instead, we consider that the enzymes are sufficiently abundant or the internal H2O2 level is sufficiently low that enzyme saturation does not systematically occur, then the scavenging rate in the model becomes a nonlinear function of the two variables A and H (see Materials and methods). Consequently, stress pretreatment may drive the homeostatic system to an equilibrium state in which the upregulated enzymes not only function to counteract the existing H2O2 flux but may also contribute with no delay (i.e. before any transcriptional response) to the scavenging of a future stepwise H2O2 exposure. Thus, unlike the linear model, this nonlinear model was able to quantitatively recapitulate the clear I0-dependent reduction in peak internal H2O2 during the challenge step (Figure 4—figure supplement 1E and F), the magnitude of which was similar to the experimentally observed Yap1-GFP nuclear relocation (Figure 4F and Figure 4—figure supplement 1D). Finally, computing the phase diagram for the nonlinear model revealed that, whereas buffering of slow external fluctuations in H2O2 levels (i.e. through cellular training) is a generic property of homeostatic systems based on negative feedback loops, the adaptation to fast fluctuations in the external stressor levels following stress preconditioning (i.e. through acquisition of stress tolerance), is a distinct property that requires a specific nonlinear scavenging model (Figure 4G).
Peroxiredoxins are key components of the H2O2homeostatic machinery
Thus far, our framework has made no assumptions regarding the nature of the scavenging enzyme(s) responsible for H2O2 degradation. Therefore, we next sought to identify which of the Yap1 regulon effectors (Godon et al., 1998) are critical for H2O2 homeostasis. During the step experiments, adaptation could result from parallel protective and repair mechanisms (DDR, protein quality control, metabolic control, H2O2 scavenging). However, the ramp experiments, by eliminating the cellular response triggered by high transient H2O2 levels, provided a unique framework to specifically decipher the core genes of the H2O2 homeostatic machinery.
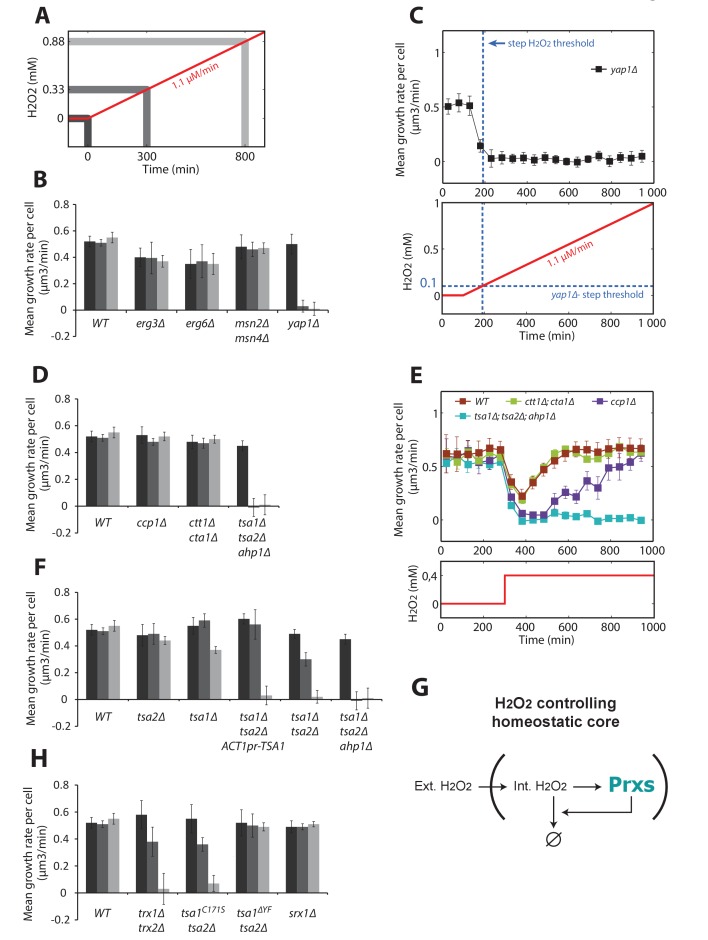
To address this, we examined the growth rates of various mutants at 300 and 800 min after initiation of a stress ramp of δ = 1.1 μM/min (Figure 5A). Deletion of Yap1 abolished adaptation (Figure 5B) with onset of growth arrest occurring at ~0.1 mM H2O2 (Figure 5C), similar to the threshold observed in step experiments (Figure 1G). The complete absence of ‘trainability’ of the Yap1 mutant contrasted with the efficient adaptation of the msn2Δmsn4Δ mutant (Figure 5B), which lacks the transcription factors involved in the general stress response. Similarly, mutants lacking enzymes involved in membrane lipid biosynthesis, erg3Δ and erg6Δ, adapted perfectly (Figure 5B), thus ruling out the possibility that reduced membrane permeability is responsible for adaptation to H2O2 ramps (Branco et al., 2004).
Figure 5. Genetic determinants of adaptation to ramped increases in H2O2.
Quantification of mean growth rate upon exposure to a linear ramp (δ = 1.1 μM/min) starting at t = 100 min in various genotypes. (A) Illustration of the H2O2 ramp experiment indicating the timing of the measurements. (B) Stress response and membrane permeability mutants. (C) Details of the ramp experiment in the Δyap1 mutant. The dashed blue lines indicate the adaptation threshold obtained in step experiments (Figure 1G). (D) Yap1 effectors mutants. (E) Step experiment performed with Yap1 effectors mutants exposed to 0.4 mM H2O2. (F) Prxs mutants. (G) Schematic of a negative feedback control showing the essential role of Prxs in the H2O2 homeostasis. (H) Mutants affecting the peroxidatic cycle of Prxs. Error bars are SEM (N > 100). See also Figure 5—figure supplement 1.
Figure 5—figure supplement 1. Quantification of Tsa1 expression from the ACT1 promoter.
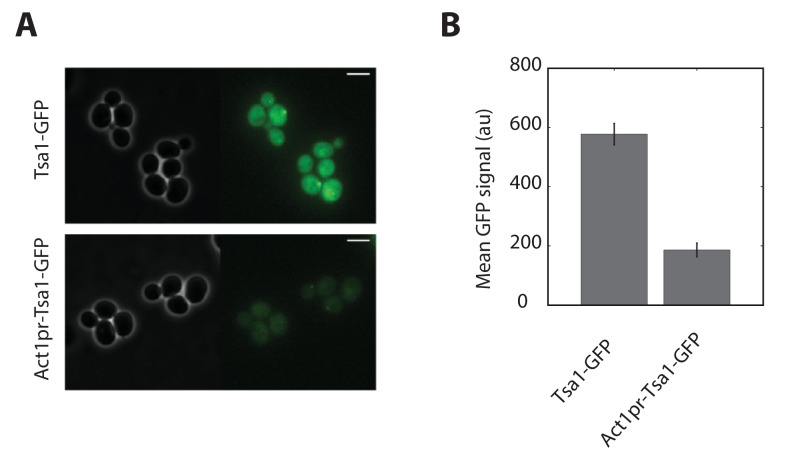
Interestingly, we found that deletion of known H2O2 scavengers, such as the mitochondrial cytochrome c peroxidase Ccp1 or the cytosolic and peroxisomal catalases Ctt1 and Cta1, did not contribute to adaptation (Figure 5D). Since these mutants were previously described to be hypersensitive to H2O2 (Jiang and English, 2006), we wondered whether they are required for adaptation to H2O2 steps. Indeed, growth recovery was delayed in the ccp1Δ mutant (but not the ctt1Δcta1Δ mutant) compared with wild-type cells following exposure to a single dose of 0.4 mM H2O2 (Figure 5E). This finding indicates that some H2O2 scavengers may actively contribute to the transient stress response even if they are not implicated in overall H2O2 homeostasis. In contrast, simultaneously deleting the three peroxiredoxin genes TSA1, TSA2, and AHP1, which encode the two yeast 2-Cys Prxs and the atypical Prx Ahp1 (tsa1Δtsa2Δahp1Δ), abolished cell growth whether the cells were exposed to H2O2 as ramps or as steps (Figure 5D and E, respectively). Additionally, the extent of adaptation was proportional to the number of cytosolic Prxs present (Figure 5F). Constitutive expression of Tsa1 under the ACT1 promoter (albeit less effective than the endogenous promoter, Figure 5—figure supplement 1A and B) in a tsa1Δ tsa2Δ background did not complement Tsa1 function, indicating the importance of the H2O2-dependent transcriptional induction of the corresponding effector genes (Figure 5F). Altogether, these observations demonstrate that Prxs are the essential antioxidants ensuring H2O2 homeostasis (Figure 5G).
2-Cys Prxs are moonlighting enzymes that reversibly switch their function from H2O2 scavengers to chaperones upon hyperoxidation of their peroxidatic cysteine (CP) and reduction of this form by sulfiredoxin (Srx1) (Biteau et al., 2003; Jang et al., 2004). To determine which of the two Tsa1 functions is involved in adaptation to stress ramps, we first tested a mutant lacking the two cytosolic Trxs (trx1Δtrx2Δ) that assist Prxs in H2O2 scavenging, but not in protein quality control (PQC). We observed that adaptation was severely compromised in this strain (Figure 5H). Next, we examined a strain lacking Tsa2 and carrying a TSA1 mutation that impairs the peroxidatic cycle of Prx but not its function in PQC (tsa1C171Stsa2Δ) (Hanzén et al., 2016), and found that this strain also adapted poorly to H2O2 (Figure 5H). However, a strain lacking Tsa2 and carrying a TSA1 mutation that prevents hyperoxidation and specifically impairs the enzyme’s PQC function (tsa1ΔYFtsa2Δ) displayed a wild-type adaptation response (Figure 5H). Lastly, we tested the Δsrx1 strain, in which the defective reduction of hyperoxidized Tsa1 and Tsa2 severely impairs H2O2 scavenging in classical techniques (Biteau et al., 2003) and which Prx-mediated PQC is also defective (Hanzén et al., 2016). Surprisingly, the Δsrx1 strain displayed wild-type adaptation to H2O2 (Figure 5H). Taken together, this genetic analysis indicated that the peroxidatic, not the chaperone, function of 2-Cys Prxs is required for adaptation to stress ramps. The dispensability of Srx1 for adaptation suggests that the ramp protocol allows the cell to maintain internal H2O2 at low levels, thereby preventing Tsa1 and Tsa2 hyperoxidation.
Tsa1 expression dynamics and nonlinear scaling with the input stress level
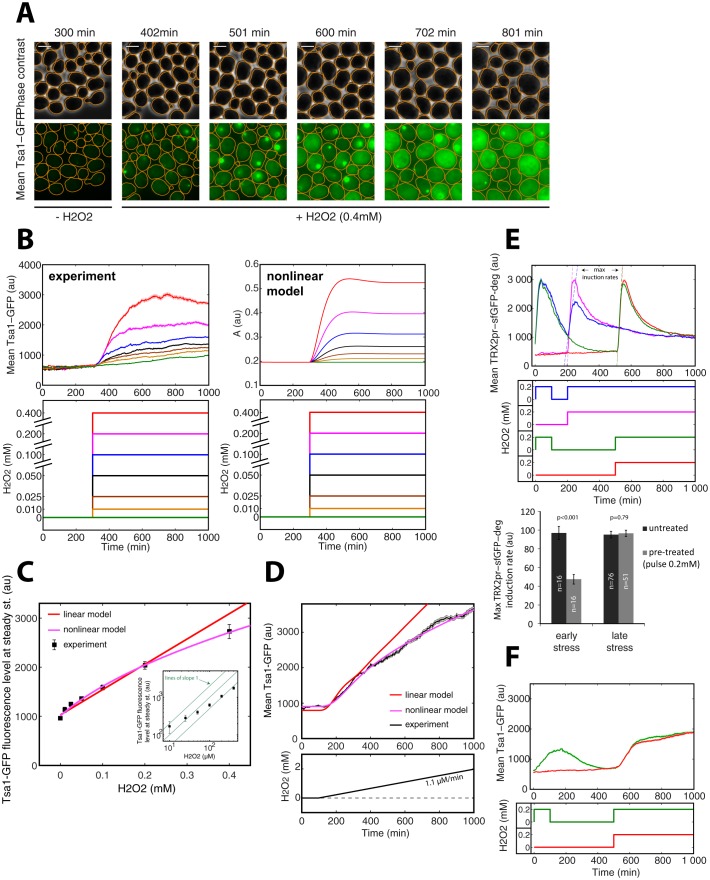
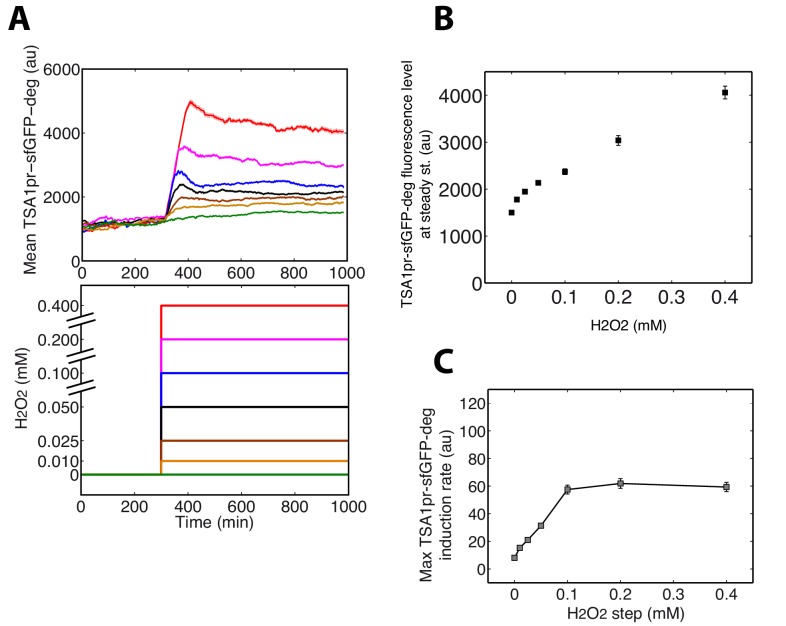
The mathematical model predicts that if Prx enzymes are the essential mediators of adaptation to H2O2, we would expect to observe strong and stable upregulation of these proteins upon exposure to H2O2 stress (Figure 4—figure supplement 1F). Indeed, a sustained increase in cytoplasmic Tsa1-GFP levels was observed upon exposure to a 0.4 mM H2O2 step (Figure 6A). This upregulation was accompanied by formation of fluorescent foci, as noted in previous studies with Tsa1-GFP (Hanzén et al., 2016; Weids and Grant, 2014). However, from the quantitative analysis of the dynamics of Tsa1-GFP protein upregulation (Figure 6B and C) and transcriptional activation (Figure 6—figure supplement 1A and B) upon H2O2 stress, we found that steady-state Tsa1 levels did not scale linearly, especially at low H2O2 concentrations (Figure 6C inset). Similarly, the scaling of Tsa1-GFP expression during a ramp experiment (δ = 1.1 μM/min) was sublinear (Figure 6D). These observations were in very good agreement with the nonlinear model, further ruling out the linear model (Figure 6B–D), and the steady-state Yap1-GFP level was also best fit using the nonlinear model (Figure 1F). These results suggest that the H2O2 scavenging capacity of the homeostatic system becomes increasingly more efficient with the accumulation of Prxs as the stress level increases, so that Prxs do not need to be upregulated in proportion to the external H2O2 concentration.
Figure 6. Tsa1 scaling properties.
(A) Sequence of phase-contrast and fluorescence images of individual cells at the indicated times after initiation (t = 300 min) of a 0.4 mM step in H2O2 concentration. The green channel represents the Tsa1-GFP signal. The white bars represent 5 µm. (B) Left: Mean cell expression (top) of Tsa1-GFP following the H2O2 steps indicated in the bottom panel. Right: Dynamics of antioxidant level with increasing stress, as expected from the nonlinear model. (C) Quantification of mean cell expression of Tsa1-GFP at steady state as a function of H2O2 concentration (from experiments in (B)). Colored lines indicate the fit of the linear (red) and nonlinear (magenta) models. Inset: log-log representation of Tsa1-GFP level with H2O2 level. Green lines indicate lines of slope one on a log-log scale, to emphasize the nonlinearity of Tsa1-GFP expression. (D) Mean Tsa1-GFP expression (top) during a ramp experiment, as indicated in the bottom panel. Colored lines indicate the fit of the linear (red) and nonlinear (magenta) models. (E) Top: Mean cellular transcription of the TRX2 promoter for cells exposed to the temporal H2O2 profiles described in the middle panel (with corresponding color coding). Bottom: Quantification of maximal transcriptional output during a step experiment performed at t = 200 min (early stress) or 500 min (late stress) with or without pretreatment. Student’s t-test. (F) Mean cellular expression of Tsa1-GFP for cells exposed to the temporal H2O2 profiles described in the bottom panel. Error bars and shaded regions are SEM (B,D-F: N > 100 for most time points, C: N > 100).
Figure 6—figure supplement 1. Analysis of the TSA1 promoter activity during H2O2stress.
We reasoned that, in this scenario, the stress-resistant state following pretreatment should quickly disappear as Prx enzymes are diluted upon removal of H2O2. To test this, we pretreated the cells with a 100 min pulse of 0.2 mM H2O2 and examined the transcriptional response (TRX2pr-sfGFP-deg) upon challenge 100 or 400 min later (Figure 6E). Notably, the transcriptional output of cells challenged 400 min after pretreatment was identical to that of cells exposed to H2O2 for the first time, indicating that the cells had returned to a naïve state by 400 min (Figure 6E upper panel: green vs red lines, and histogram). In contrast, TRX2pr-sfGFP transcription was lower in cells challenged 100 min after pretreatment compared with naive cells (Figure 6E, blue vs pink lines, and histogram). In parallel, we also observed that Tsa1-GFP levels were comparable to the basal level after a 400-min recovery period, but not after 100 min (Figure 6F), suggesting that Prx levels are tightly associated with the H2O2 buffering efficiency.
A Tsa1-dependent hormetic effect of H2O2 on replicative lifespan
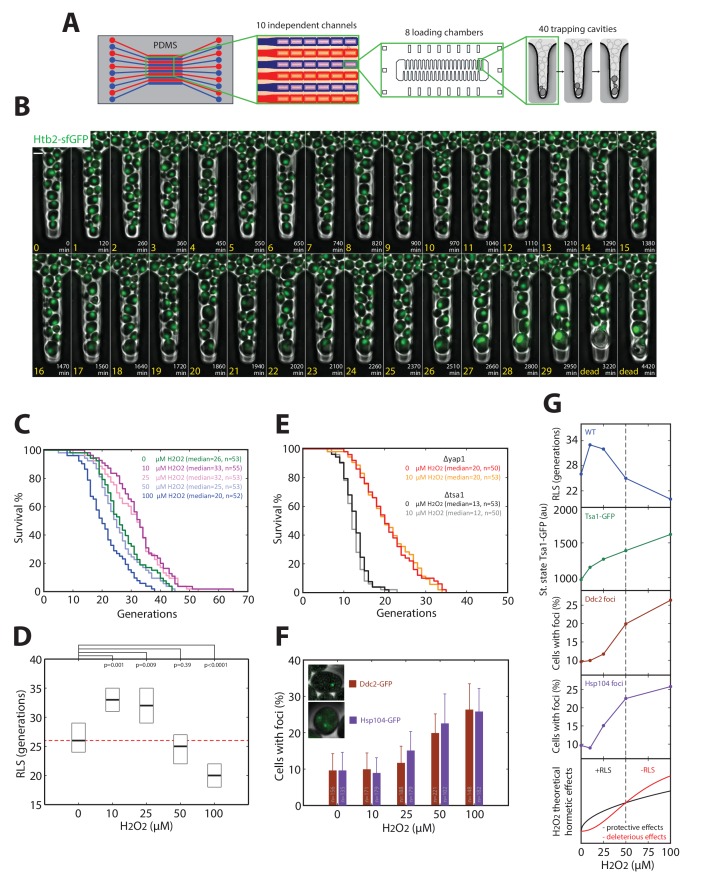
The nonlinear scaling of Tsa1 expression upon exposure to H2O2 may prove beneficial to cellular physiology in general, particularly during replicative aging. In support of this, the extension of both chronological and replicative longevity by caloric restriction has been shown to be mediated, at least in part, by activation of H2O2-dependent genes (Mesquita et al., 2010; Molin et al., 2011). Furthermore, recent work has shown that Tsa1 plays a role in processing of age-related protein aggregates, and overexpression of Tsa1 alone increases longevity through a mechanism involving the PQC machinery (Hanzén et al., 2016). To explore how activation of the H2O2 homeostatic machinery affects longevity, we measured the replicative lifespan (RLS) of cells exposed to various doses of H2O2. For this, we developed a microfluidic device that allows individual cells with different genetic backgrounds to be tracked microscopically from birth to death in separate channels (Figure 7A and B and Video 6). This is similar to our previously described device (Fehrmann et al., 2013), except that the large increase in capacity allows cells from up to 10 mutant strains to be tracked in parallel.
Video 6. Replicative lifespan monitoring (refers to Figure 7).
Movie showing the entire lifespan of a cell from birth to death in a cavity of PDMS device. The white bar represents 5µm.
Figure 7. Hormetic effect of H2O2 on replicative longevity.
(A) Sketch of the microfluidic device used for replicative aging experiments. (B) Sequence of overlaid phase-contrast and fluorescence images (Htb2-sfGFP, used as a nuclear marker to score cell division) of mother cells growing in individual cavities. Numbers indicate the timing (white) and number of cell divisions (yellow) for the mother cell at the tip of the cavity. (C) Survival curves for wild-type cells growing in media containing H2O2 at the indicated concentrations. (D) RLS as a function of H2O2 concentration. Box represents median and 95% CI. U test. Red line shows the median RLS for 0 mM H2O2. (E) Survival curves of Δyap1 and Δtsa1 mutants in the presence or absence of 10 μM H2O2. (F) Frequency of specific fluorescence foci (Ddc2-GFP, Hsp104-GFP) as a function of H2O2 concentration. Error bars are 95% CI. (G) (Top to bottom) Recapitulation of measurements of RLS (blue), Tsa1-GFP steady-state upregulation (green), and frequency of damage (DDC2 foci in brown, Hsp104 foci in purple). Bottom: Conceptual sketch showing the contributions of protective (black) and deleterious (red) effects of H2O2 on RLS.
Using this technique, we observed that H2O2 had a biphasic effect on RLS. Exposure to 10 and 25 μM H2O2 significantly increased RLS up to ~25% compared with unstressed cells (median RLS generations of 26, 33, and 32 at 0, 10, and 25 μM H2O2 respectively), whereas concentrations > 50 μM H2O2 decreased RLS (median RLS of 25 and 20 generations at 50 and 100 μM H2O2, respectively; Figure 7C and D). This suggested that H2O2 had a hormetic effect, in which low doses of H2O2 were beneficial and improved RLS, whereas higher doses had deleterious consequences on longevity (Ristow and Schmeisser, 2011).
We next determined whether this effect was dependent on activation of the H2O2 homeostatic core machinery. Deletion of Yap1 or Tsa1 abolished the increase in longevity at low H2O2 doses (Figure 7E), implicating these proteins in the hormetic effect. We hypothesized that hormesis results from an unbalance between the substantial upregulation of Tsa1 observed at low H2O2 levels and the production of deleterious cellular damages. Indeed, the fraction of cells with foci of Ddc2-GFP (DDR marker) and Hsp104-GFP (protein aggregate marker) was similar to the unstressed control up to 25 μM H2O2 (Figure 7F and G), while Tsa1 level experienced a ~ 25% increase in this range of concentration (Figure 6B and C). Above 25 μM H2O2, however, the increase in Tsa1 expression was relatively lower than the increase in foci (Figure 7F and G). Collectively, these data suggest that nonlinear activation of the homeostatic machinery in response to H2O2 leads to a biphasic effect on replicative longevity as recapitulated on Figure 7G.
Discussion
In the present study, we combined microfluidics technology with yeast genetics and live-cell imaging to perform a comprehensive analysis of the complex adaptive properties of budding yeast to oxidative stress. The decisive element of our methodology was the precise temporal control of oxidative stress levels, without which the detailed mechanisms of adaptation to H2O2 stress could not have been quantitatively addressed. Indeed, it is likely that many of the discrepancies observed in studies of cellular resistance to H2O2 using classical bulk techniques originate from both the lack of environmental control and the population size-dependent consumption of the stressor by the cells growing in a test tube or on a plate. Our methodology provides a rationalization of H2O2 resistance assays, in which the final H2O2 concentration and its rate of increase share equal importance in determining cell fate. To date, only a few studies have used linear ramps (Muzzey et al., 2009; Sorre et al., 2014; Young et al., 2013) or other time-varying stimuli (Castillo-Hair et al., 2015) to decipher how temporal patterns of specific inputs govern activation of a regulatory network and the determination of cell fate. We anticipate that such precise dynamic environmental control will become increasingly important for refining our understanding of information processing by signaling networks.
The use of customized temporal stress patterns appears to be a unique methodology for unraveling the specific functional role of genes involved in H2O2 homeostasis. Our analysis has not only identified the peroxiredoxins coding genes TSA1, TSA2, and AHP1 as key elements in ensuring adaptation to stress ramps but also revealed that other antioxidant genes, such as CCP1, CTT1, and CTA1, are not required under these conditions. However, CCP1 does contribute to growth rate recovery in the step experiments. These data, therefore, suggest that Prx activity is the major determinant of H2O2 homeostasis and is essential regardless of the temporal stress pattern, whereas CCP1 may only contribute to detoxification during the high transient H2O2 peak that accompanies acute stress. Future functional studies will be instrumental in dissecting the relative contributions of all H2O2-scavenging enzymes.
Beyond the necessary accuracy of a homeostatic control mechanism, our study stresses that ‘trainability’ is another essential functional property intimately linked to the response time of the underlying regulatory mechanism. Training has important physiological implications; namely, that cells can be acclimated to much higher stress levels (>10 fold) when the rate of increase is low compared with acute exposure. The quantitative framework developed here formalizes the key parameters, such as enzyme dilution rate, that control the extent of trainability in a homeostatic system based on transcriptional regulation. In addition, the framework suggests that there is an optimal (i.e., fastest) stress pattern (following the Hmax = Htox contour line on Figure 3C) for driving a homeostatic system to its maximal stress-buffering capability.
Interestingly, the ability to resist progressively increasing environmental insults resembles the concept of mithridatism, which was originally described as a defense strategy against poisoning, but which has lacked overall biological relevance due to the absence of similar mechanistic evidence (Valle et al., 2012). In the context of H2O2 stress, our study identifies a new form of mithridatism at the cellular scale that could be quantitatively explained by a mathematical description of a generic negative feedback-based regulatory network. Therefore, we envision that this framework could be transposed to other homeostatic systems and, in particular, may find potential technological applications in which improved cellular adaptation is desired without any genetic modification, such as environmental detoxification and chemotherapy.
An important outcome of our study is the establishment of a clear distinction between training and acquired stress resistance. Although both mechanisms provide a way to increase basal cellular stress resistance, their functional properties and their underlying mechanisms are completely different. Unlike training, which enables increased adaptation to slow stress fluctuations, acquired stress resistance elicits improved survival of preconditioned cells to rapid environmental changes. This latter phenomenon cannot be described using a linear model but can be explained by nonlinearity in the control loop, in which the H2O2 degradation rate depends on both the level of scavenging enzymes and internal H2O2 concentrations.
Even at basal levels, Prxs are very abundant proteins (~1% of the total dry cellular mass in mammals, [Low et al., 2007]), and our data show that their expression increases up to fivefold upon exposure to H2O2. Therefore, it is likely that the cellular concentration of the reduced form of these enzymes always surpasses the internal H2O2 concentration, and, consequently, the main hypothesis of our nonlinear model is that the H2O2 scavenging rate of Prxs is limited by the internal H2O2 concentration. Further biochemical studies of the entire peroxidatic cycle will be necessary to understand how and why the Prx scavenging rate depends on internal H2O2 levels in vivo, since other Yap1-dependent effectors, such as thioredoxins and sulfiredoxins, control the pool of reduced Prxs upon stress exposure. In the meantime, we speculate that the reason redox homeostasis relies on these extremely abundant stoichiometric enzymes rather than on catalases (which catalyze the dismutation of H2O2), as shown here, is that nonlinearity in the scavenging rate has important physiological consequences, such as stress tolerance.
The phenomenon of acquired stress resistance illustrates the plasticity of the homeostatic machinery and shows that cell survival threshold is not static but may be improved by previous environmental conditioning, following the principles of adaptive homeostasis (Davies, 2016). A unique feature of our study is to provide a framework to quantitatively explain the origin of this anticipatory behavior, as well as to link this phenomenon to the nonlinearity of stress doses responses (Zhang and Andersen, 2007; Zhang et al., 2010). Previous work has pointed to the existence of cross-protective effects, whereby exposure to a particular stress (e.g. heat, ethanol) increases tolerance to subsequent oxidative stress (Mitchell et al., 2009). Since Prx genes are also regulated by the transcription factors of the general stress response, Msn2/Msn4, we envision that the induction of tolerance to H2O2 by other stressors may be mediated by the same principles as those described here. More generally, it will be interesting to see how the proposed mechanism of tolerance applies to other homeostatic systems in which nonlinear stressor degradation might be conserved (Zhang and Andersen, 2007).
The last facet of nonlinear feedback regulation that emerges from our quantitative study is related to the concept of hormesis (Calabrese et al., 2015). Due to the substantial upregulation of Prxs in response to very low doses of H2O2, the tradeoff between beneficial and deleterious effects of H2O2 leads to a biphasic effect on cellular longevity as a function of H2O2 level. The effect of H2O2 on longevity provides a striking model of lifespan extension induced by environmental perturbation, similar to the effects of caloric restriction. Interestingly, this observation not only complements the previously described hormesis-like effect of H2O2 on chronological aging (Mesquita et al., 2010) but also suggests a simple mechanistic explanation in which the H2O2 homeostatic machinery plays a central role. Therefore, our study emphasizes that complex functional properties, such as acquired stress tolerance and hormetic lifespan effects, can only be understood by developing specific approaches that bridge the molecular architecture of regulatory pathways to its quantitative dynamical properties.
Materials and methods
Strains and plasmids
All strains were congenic to S288C (Sikorski and Hieter, 1989; Huh et al., 2003) unless specified. Strains generated in this study were made using standard genetic techniques or classical PCR-mediated genome editing. See Supplementary file 1 for the list of strains used in this study.
The transcriptional reporter strains TSA1pr-sfGFP-deg, TRX2p-sfGFP-deg were generated by a one-step cloning-free method (Huber et al., 2014). The promoters of TSA1, TRX2 were duplicated in strain SY992 and a sfGFP-degron (superfolder GFP fused to CLN2 PEST sequence) tag was simultaneously inserted downstream of them. The genes TSA1, TRX2 remain fully intact. The sequences of homology (used to design the primers) of the PCR products that duplicated the promoters at their genomic locations in vivo are listed below:
Sequences of homology used in PCR primers for promoter duplication in vivo
| Target locus | Sequence of homology to the target locus |
|---|---|
| TSA1pr-1 | TTCCCCTCGTTCAATTGCTCACAACCAACCACAACTACATACACATACATACACA |
| TSA1pr-2 | CCTTGATCTGGCTAAACTTGACTTCGTCAATTTCATTCAAGTGGAGATAGTCTCG |
| TRX2pr-1 | TTATACACGCACACATACACGAGAGTCTACGATATCTTTAAATAACACATCAATA |
| TRX2pr-2 | TGGATCATGGGCGCATGTGAACCGTACCCACCGAATTGCGCTTGAAGTGTGTCCA |
The strain tsa1Δ; tsa2Δ; ACT1pr::TSA1-GFP was generated by substituting the promoter region of TSA1 by the promoter of ACT1 in strain TSA1-GFP (BY4741). The cassette kanMX4::ACT1pr was amplified by PCR and then transformed into the strain TSA1-GFP (BY4741) using standard lithium acetate protocol. The primers contained sequences homologous to the TSA1 genomic locus that are listed below:
Sequences of homology used in PCR primers for promoter substitution
| Target locus | Sequence of homology to the target locus |
|---|---|
| TSA1-1 | CCACCGCCACAGGTGCGCAACCTCATCTCTACATTCCTGATGAAGACTAA |
| TSA1-2 | ACGGCAGTTTTCTTAAAAGTTGGAGCTTGCTTTTGAACTTGAGCGACCAT |
To introduce tsa2Δ mutation, the transformed strain was crossed with strain Y14287.
H2O2 stability and dosage in the microfluidic setup
The H2O2 (Hydrogen peroxide solution 35wt. % in H2O, 349887–500 ML, Sigma) was mixed in the SCD media at the suitable concentration prior the microfluidic experiment. In order to increase the stability of the H2O2 during the microfluidic experiments, the SCD media were kept on ice. Temperature measurements showed that this procedure does not affect media temperature in the microfluidic device since media reached room temperature before entering the device (data not shown). The H2O2 concentration was measured using a colometric H2O2 assay kit (OxiSelect Hydrogen Peroxide Assay Kit (Colorimetric), STA-343, EUROMEDEX, France) in media samples taken from the outlet of the chip.
Dosage experiments were run in triplicates.
Consumption of H2O2 in bulk experiment
Over-night SCD-media culture (strain WT BY4742) was diluted in SCD to OD600 = 0.1 and incubated at 30°C, 220 rpm. At OD600 = 0.5, H2O2 was added to final concentration of 0.4 mM. Consumption of the H2O2 was determined by measuring the H2O2 concentration in the cell media over time. Bulk H2O2 consumption experiments were performed six times.
Microfabrication and microfluidics setup
Microfluidic chips were designed and made using standard techniques as previously described (Fehrmann et al., 2013). The microfluidic master used to assess the adaptation to oxidative stress was made using standard SU-8 lithography process at the ST-NANO facility of the IPCMS (Strasbourg, France). The microfluidic master for aging studies was made using similar techniques in the FEMTO-ST nanotechnology platform of the French Renatech network (Besançon, France). Prototypic molds were replicated in epoxy to ensure long-term preservation. The micro-channels were cast by curing PDMS (Sylgard 184,10:1 mixing ratio) and then covalently bound to a 24 × 50 mm coverslip using plasma surface activation (Diener, Germany).
Microfluidic chips were connected using Tygon tubing and media flows were driven by a peristaltic pump (Ismatec, Switzerland) with a 30 μL/min flow rate. Media switches -synthetic complete 2% dextrose (SCD), with or without H2O2 at the appropriate concentration- were performed using a computer-controlled electro-valve (Biochemfluidics) or using a media multiplexer (Elvesys). Linear ramps of medium containing H2O2 were achieved using a custom setup allowing a progressive increase in H2O2 concentration in the main medium tank.
For aging experiments, cells were maintained in a chip during typically 140 hr with constant medium perfusion (flow rate 10 μL/min). Cells started to enter the cavity about 20 hr following their loading in the device. In case H2O2 was used throughout the assay, fresh medium was prepared every 24 hr to prevent any decay in H2O2 concentration over time.
Media diffusion through the microfluidics device/ effects of cell confinement
The diffusion of the media in the trapping cavities was tested using a fluorescein dye assay. To do this, fluorescein (Sigma) was flown trough the microfluidics device either in the absence or in the presence of a dense microcolony of cells and fluorescence images were snapped every 2 s. The fluorescence was measured both in the supply channel at the border of the trapping cavity and in the middle of the trapping cavity. As expected, the fluorescence in the supply channel increased almost instantaneously as shown in Figure 1—figure supplement 1, whereas the increase of the fluorescence in the middle of the empty trapping cavity displayed a delay (half rising time t1/2 = 21 s). A comparable time (t1/2 = 24 s) was obtained in the presence of a dense microcolony of cells, hence showing that diffusion is not impaired in a crowded environment.
Time-lapse microscopy
All time-lapse experiments have been performed at least two times.
Freshly thawed cells were grown overnight at various final cell densities. In the morning, log phase cells were allowed to grow a few divisions and were transferred into the microfluidic device. Cells were imaged using an inverted Zeiss Axio Observer Z1 (adaptation assay) or a Nikon Tie (aging experiments). Focus was maintained using dedicated hardware throughout the assays. Fluorescence illumination was achieved using LED light (precisExcite, CoolLed or Lumencor) and light was collected using a 100× N.A. 1.4 objective and an EM-CCD Luca-R camera (Andor; adaptation experiments) or an Hamamatsu Orca Flash 4.0 (Aging experiments).
We used automated stages in order to follow up to 20 (adaptation experiments) or 60 (aging experiments) positions in parallel over the course of the experiment. Images were acquired every 3 min (adaptation experiments) or 10 min (aging experiments).
Temperature control was achieved using custom sample holder with thermoelectric modules and an objective heater with heating resistors. Temperature control was achieved using a PID controller (5C7-195, Oven Industries).
Image analysis
Raw images were processed using custom software, called phyloCell, based on MATLAB and the image-processing toolbox (Fehrmann et al., 2013; Paoletti et al., 2016). This software features a comprehensive graphical user interface to perform segmentation/tracking and to introduce manual error corrections. The software is available for download on GitHub (Charvin, 2017). A copy is archived on https://github.com/elifesciences-publications/phyloCell. In this study, the software was used to segment cell contours based on phase-contrast images; to track cells over time; and to measure the fluorescence within the cells, including nuclear localization of fusion proteins.
Quantification of growth rate
After segmentation of cell contours from time-lapse data, the volume V of individual cells was estimated by spherical approximation of the cellular shape (Figure 1—figure supplement 2A). The volume increase rate (which we refer to as cellular growth rate) was then determined for each time point as the increase in the cell volume in consecutive frames per unit of time (cell growth rate at t1 = (V(t2)-V(t1))/(t2-t1), where t2-t1 = 3 min). More specifically, the measurements of mean growth rate per cell used throughout this study (which reflects the metabolic capacity of a population of cells, see below) were measured by averaging the volume increase rate of individual budded cells over large micro-colonies of cells, whereas unbudded cells were not considered in this analysis. This is motivated by two reasons: first, the increase in cell volume is higher during the budded phase of the cell cycle, and therefore, it provides a more robust estimate of cell growth. Second, the purpose of this measurement is to provide a readout of cellular metabolic activity, independently of cell cycle progression. When cells are exposed to H2O2, the fraction of budded cells increases due to the activation in some cells of a G2/M checkpoint, but this cell cycle arrest is not necessarily accompanied by a change in metabolic activity. Therefore, if we were pooling the growth rate of both unbudded (slow volume increase) and budded cells (fast volume increase), the change in the repartition of each type of cells upon H2O2 exposure would induce a misleading change in the mean growth rate per cell, which would be unrelated to a potential change in metabolic activity. Instead, selecting only the budded cells provides a relevant assessment of cell growth rate, which is unaffected by the inherent variations in cell cycle progression during stress exposure (Figure 1—figure supplement 2B).
Noteworthy, the definition of growth rate used in our study (dV/dt) differs from the classical one, which is given by μ= (1/V) x dV/dt. The reason why we used the simple first time derivative of cell volume is because the exponential growth model appeared to be irrelevant to assess the change in metabolic activity during stress exposure. Indeed, the growth rate of cells (defined as dV/dt) appeared to be independent of cell volume (Figure 1—figure supplement 2C). In addition, using dV/dt as readout of growth rate, we observed a complete recovery following the exposure to stress, suggesting that cells had recovered a normal metabolic activity. However, using μ= (1/V) x dV/dt as the definition of growth rate, we would have missed the recovery in metabolic activity, since the mean cell volume of adapted cells following the recovery was higher than that before the stress (Figure 1—figure supplement 2D), due to cell cycle arrested – yet metabolically active-cells.
Quantification of Yap1 nuclear localization
Following the segmentation of the nucleus using the Htb2-mCherry signal (Figure 1D), nuclear Yap1-GFP localization was measured at each frame by subtracting the average cytoplasmic fluorescence level from the mean nuclear level in order to remove the background. In addition, we noticed that there was a drift in the fluorescence level over time, which, for unclear reasons, appeared to mostly affect the cytoplasmic level. Therefore, we used a no-stress control experiment, in which Yap1-GFP nuclear localization was supposedly constant, to measure the extent by which background subtraction modifies the quantification of the nuclear localization over time. This measurement was then used to correct the drift observed in experiments in which a stress was applied.
Quantification of cell survival using a propidium iodide (PI) assay
Media containing 5 µg/ml PI (Sigma, Saint-Louis, MO, USA) was flown through the microfluidics device during a 0.6 mM H2O2 step experiment, and images were recorded continuously. Dead cells, which experienced a loss of cell membrane integrity, incorporated the dye and displayed red fluorescence, as reported in Figure 2—figure supplement 1.
Quantification of the phase-contrast brightness of the cells
We used the presence of persistent bright vacuoles as a readout to characterize the cells experiencing a permanent growth arrest following a H2O2 stress. To quantify this, we measured the mean intensity of the highest decile in the phase-contrast channel of the images.
Protocol to generate linear stress ramps
In order to generate ramps of H2O2 stress, we used an extra peristaltic pump driving the flow of a H2O2 stock solution to gradually increase the H2O2 concentration in the medium tank used to feed the microfluidic device (Figure 3—figure supplement 2A). Assuming C1 and V1, the concentrations and volume of the medium tank, respectively, μ1 the flow rate used to perfuse the microfluidic device from the tank, C0 and μ0 the concentration and flow rate from the H2O2 stock solution, using the conservation of mass, one can derive the evolution of V1 and C1 with time:
In the particular case of identical flow rates (), V1 is constant and the evolution of C1 with time is given by:
where . When t << 1/δ, then the concentration C1 increases linearly as:
With μ0 = 30 μL/min and V10 = 1L, δ = 3. 10−5 min−1. Therefore, we should get a linear slope of 3 μM/min using C0 = 100 mM, provided t << 105 min, which is much higher than the duration of experiments (typically 103 min).
However, H2O2 dosages during the calibration of stress ramp experiments showed that the actual concentrations were systematically 21.5 ± 2% lower than expected for all tested time points (0–1000 min) and ramp slopes (1.4–22.4 µM/min) (data not shown). To explain the origin of this deviation from the expected measurements (which stands higher than the 10% decay observed during step experiments, see Figure 1C), we hypothesize that it can be attributed to a higher H2O2 degradation rate in the medium tank during ramp experiments because the tank was not kept on ice due to the need to perform constant mixing using a magnetic stirrer. Therefore, the actual evolution of concentration in the medium tank is given by:
For instance, a 1.1 µM/min ramp slope is obtained with μ0 = 30 μL/min and V10 = 1L and C0 = 46.67 mM.
Mathematical model of the H2O2 homeostatic machinery
To understand the mechanism that underlies H2O2 homeostasis, we developed a mathematical framework based on the negative feedback regulation in the Yap1 network. The model was used throughout this study to help identify and formalize the emergent properties of this system through iterative cycles of predictions and experimental challenges, rather than to perform exhaustive data fitting to retrieve individual parameter values. In the following, we describe in details the principles of the mathematical model.
A - Model assumptions (refers to Figure 3)
The model describes the dynamics of scavenging of internal H2O2 (variable H) by antioxidants enzymes. Yap1 activates the synthesis of mRNAs from antioxidant genes (AmRNA), which are in turn translated into antioxidant enzymes (variable A) in response to an input H2O2 stress (parameter I). The evolution of AmRNA, A and H with time can be written as:
| (1) |
| (2) |
where ε represents the internal H2O2 production rate due to cellular activity, α is the rate constant associated with H2O2 diffusion, is the rate of H2O2 scavenging by antioxidants, and are the transcription and translation antioxidants, respectively, and and are the degradation rate constants associated with mRNA degradation and antioxidant dilution (due to cell growth), respectively; and are functions of H that characterize the sensitivity to H2O2 of scavenging and A transcription, respectively.
Although the purpose of this modeling approach is to make the most simple mathematical description using a limited set of variable in order to get an in-depth understanding of the distinct functional role played by each model feature, we chose to describe antioxidant transcription and consider mRNA level as a separate variable because it introduces a delay in the antioxidant response which is mandatory to explain experimental results reported in Figure 3 (see also Figure 3—figure supplement 1).
For the sake of simplicity, the effect of H2O2 on cellular physiology (i.e. cell growth, overall transcription and translation machinery) is not considered in the present model, even though it is likely to provide additional regulatory feedbacks and modify the detailed dynamics of activation of the homeostatic system. In particular, we deliberately chose to consider the cellular growth rate μ’as a constant, even though our experiments clearly indicated that growth rate is transiently affected during step experiments. This assumption, which does not alter the generality of our analysis, is justified below.
Last, even though this model features an important number of parameters (i.e. 7), the analysis below reveals that the detailed dynamical properties of the system are only dependent upon a combination of parameters, but not on the individual values.
B- Steady state for the linear model: f(H)=1, g(H) = H (refers to Figure 1F and Figure 3)
In this section, we assume that the H2O2 scavenging rate depends on antioxidant concentration A but is independent of internal H2O2 level H, that is f = 1. In addition, we hypothesize that the antioxidant transcription rate linearly increases with H.
Under these assumptions, it can be shown that the equilibrium state of the system described in Equations (1-3) is such that:
| (4) |
| (5) |
| (6) |
In the following, we set ε = 0 for the sake of simplicity, unless specified otherwise.
C- Particular case: the ‘integral feedback’ model: μ’=0 (refers to Figure 1F)
From Equation (4), in the particular case in which μ’=0 (i.e. antioxidant dilution can be neglected), the equilibrium is such that the internal H2O2 concentration is strictly zero: Heq = 0, independently of the input H2O2 level I. This indicates that the system displays perfect homeostatic properties. This case corresponds to an ‘integral feedback’ system (Muzzey et al., 2009; Yi et al., 2000), in which the response of the scavenging machinery (production of antioxidants) is proportional to the integral over time of a function F (which can be derived from Equations (1) and (2)) that only depends on H, as follows (2):
| (7) |
Therefore, during the transient regime following the exposure to a step in H2O2, as long as is not strictly zero, A keeps building up, thus ensuring a complete scavenging of internal H2O2 (i.e. Heq = 0). Figure 3—figure supplement 1A illustrates this property of the model, by showing the evolution of model variables upon exposure to a given H2O2 concentration. Such integral feedback control is widely used in systems engineering to ensure perfect tuning of a controlled variable (e.g. temperature control).
However, the integral feedback model is ruled out by the experimental observation that Heq is not zero and depends on the external H2O2 level (Figure 1F). In contrast, with μ’≠0, Heq is proportional to the external H2O2 concentration (Equation (4)), in agreement with Figure 1F.
Therefore, the enzyme dilution rate (set by μ’) directly controls internal stress concentration at steady-state and therefore the accuracy of the homeostatic system. However, numerical simulations in Figure 3—figure supplement 1A and B show that it does not impact the transient increase in internal H2O2 levels during a step experiment, presumably because other time constant governs the kinetics of activation of the negative feedback loop. Therefore, the simulations in Figure 3—figure supplement 1A and B demonstrate that a temporary variable growth rate (as experimentally observed), would not change the transient dynamics of the Yap1 signaling pathway and therefore would have no effect on adaptation to H2O2 steps.
In addition, taking this observation into consideration would require to model the additional feedback of internal H2O2 level on enzyme dilution rate. This additional feature would introduce the following drawbacks: (1) the model would no longer be linear (since the enzyme dilution rate would necessarily be a nonlinear function of internal H2O2 and antioxidants concentration); (2) by making the model more cumbersome, it would be difficult to interpret the respective effects of each feature of the model. Therefore, for sake of simplicity, this possibility has not been investigated in the scope of this study.
D- Response to linear ramps for the linear model (refers to Figure 3)
In this section, we calculate the response of the model to a linear ramp of H2O2, defined by:
, where δ is the slope of the ramp (μM/min) and t is the time.
Particular case of the integral feedback (μ’=0)
Even though this case does not match experimental findings (see above), it is instrumental to calculate the behavior of this system when it is submitted to linear ramps.
Under this assumption, we can show that A follows:
| (8) |
AmRNA is given by:
| (9) |
and H is given by:
| (10) |
Therefore, interestingly, the internal H2O2 does not vary with time and its magnitude is proportional to the slope of the ramp . More specifically, since cells should adapt as long as , this predicts that cells can tolerate a maximum slope defined by:
| (11) |
Figure 3—figure supplement 1C illustrates the plateau of H reached during linear ramps for the integral feedback model.
General case of the linear feedback model (μ’≠0)
In this case, unlike the integral feedback model, it can be shown that H increases linearly with time as:
| (12) |
as shown on the numerical simulation on Figure 3—figure supplement 1D. Therefore, under this assumption, the system has weaker homeostatic capabilities, compared to the integral feedback case.
Unlike the transient regime observed in step experiments, under ramping stress, the evolution of H with time greatly depends on the dilution rate μ’. Therefore, in this case, it is probable that the growth rate arrest observed with steep ramps may help the cell survive to higher absolute stress levels by allowing more time for the cells to accumulate antioxidants enzymes, provided that their synthesis rate is not affected by stress. This possibility can be better understood by considering the adaptation to an arbitrary stress pattern, using the ‘phase diagram’ described in the next section. On this plot, the iso-H line on the phase diagram delimitating cell survival and arrest would be in between those displayed on Figure 3—figure supplement 1E (μ’=0) and Figure 3—figure supplement 1F (μ’ ≠ 0).
E- Characterization of the training capabilities – ‘phase diagram’ (refers to Figure 3)
According to the analysis performed in the previous section, the internal H2O2 level reached upon stress exposure is proportional to the magnitude of the stress I during step experiment, but also strongly depends on the slope d = dI/dt of the ramp when using linearly increasing stress. By combining these two types of external perturbations, we can calculate numerically the maximal internal H2O2 level Hmax reached when the system is submitted to a stress of magnitude I applied with a rate δ (as described on the two-dimensionnal plot in Figure 3C, Figure 3—figure supplement 1E and F).
We assume that there is toxicity threshold Htox (see Figure 3C) that is defined by the transient internal H2O2 level obtained when the cells are exposed to the limit concentration of 0.6 mM H2O2 in step experiments. Based on this, the ‘iso-H’ line defined by Hmax = Htox splits the (I, d = dI/dt) space into a domain where adaptation is possible (Hmax < Htox) and a domain where adaptation is prohibited (Hmax > Htox). For the linear models, the iso-H lines can be calculated analytically, see below. The interest of such ‘phase diagram’ is that it provides a synthetic overview the homeostatic capabilities of the system in response to an arbitrary linear perturbation.
Particular case of the integral feedback (μ’=0)
In this particular case, in addition to the 0.6 mM threshold for step experiments (see vertical dashed line on Figure 3—figure supplement 1E), there is a threshold ramp slope (defined in the previous section) beyond which adaptation is prohibited (horizontal line on Figure 3—figure supplement 1E). Conversely, this model implies that there is no limit in adaptation provided the slope of the ramp is less than . In practice, however, this prediction is challenged by experimental observation (Figure 3) showing that there is a limited range of I allowing cell adaptation, even with very low ramp slopes. Therefore, the experiments focused on adaptation to a linear ramp further invalidate the integral feedback model.
General case of the linear model (μ’≠0)
In this case, in addition to the 0.6 mM threshold for step experiments (see vertical dashed line on Figure 3—figure supplement 1F), one can calculate the asymptotic limit of the iso-H line (Hmax = Htox) for slow ramps:
| (13) |
where:
| (14) |
Equation (13) has two important implications: first, the maximum allowed ramp slope is a linear function of the magnitude of the stress I, and its slope is set only by the antioxidant dilution rate . Second, there is an absolute H2O2 concentration beyond which no adaptation is possible, as described below (Figure 3—figure supplement 1F).
Absolute adaptation concentration Iabs
Equation (14) defines the absolute H2O2 concentration that allows cellular adaptation. As expected intuitively, it appears as the balance between the kinetic constants that favor adaptation (scavenging rate, gene expression rate) and the ones that tend to increase internal H2O2 levels (H2O2 diffusion rate, dilution rate of antioxidant mRNA and proteins). Therefore, the experimental measurement of Iabs (as shown in Figure 3—figure supplement 2F) provides an assessment of the overall homeostatic capabilities of the system.
Influence of the delay in antioxidant response on the training capabilities
In addition to experimental measurement of growth rate during ramp experiments, Figure 3F displays the iso-H line (Hmax = Htox) as expected by the model, in which parameters values are similar to Figure 3—figure supplement 1I. The set of parameters was chosen to match the experimentally determined Iabs = 7.3 mM. Interestingly, in these conditions, the model tends to overestimate the adaptation capabilities for steep ramps (δ > 10 μM/min). We interpret this disagreement by the fact that there is a delay in the synthesis of antioxidants that render the system more sensitive to steep ramps. Indeed, by changing the kinetics of mRNA stability (by adjusting the value of decay rate to µ = log(2)/40 min−1 [Geisberg et al., 2014]), while maintaining the same value for Iabs, we obtained a better agreement with experiments (see Figure 3F and Figure 3—figure supplement 1G–1J).
F- Steady state for the nonlinear model: f(H) = H/(H+W), g(H) = H/(H+K) (refers to Figures 1 and 6)
This model constitutes a refinement of the linear feedback model described above, which fails to describe the scaling of Tsa1-GFP level with increasing H2O2 levels (Figure 6).
Saturation in antioxidant transcription rate
To this end, the first assumption to be added in the model is linked to the observed saturation in Tsa1 transcription rate (Figure 6—figure supplement 1C). Assuming g(H) = H/(H+K), where K is a constant that sets the saturating H concentration, the steady-state level for H is given by:
| (15) |
with:
Therefore, even though Heq is a priori a nonlinear function of I, when I << , Heq varies linearly with I:
| (16) |
Similarly, Aeq is given by:
In contrast, when I = Iabs and above, the equilibrium is given by:
| (17) |
and
| (18) |
which is expected since, under these conditions, the system has reached its maximum scavenging capabilities.
Therefore, over an extensive range of concentration (since Iabs was shown to be larger than 7 mM, see Figure 3—figure supplement 2F), the level of antioxidants should scale linearly with the stress level I. This prediction is contradicted by the nonlinear scaling observed experimentally, especially for low H2O2 values (Figure 6), therefore indicating that an additional assumption is required to explain the data.
Nonlinear H2O2-dependent scavenging rate
In the following, we assume that, in addition to saturation in antioxidant transcription rate, the rate of H2O2 scavenging by antioxidants is set by: f(H) = H/(H+W), where W represents the internal H2O2 concentration at which the scavenging rate saturates. In addition, unlike the previous sections, we now hypothesize the existence of a non-zero basal internal H2O2 production rate ε.
The steady-state levels Heq and Aeq are given by the solution of a third-degree equation. However, in the particular case in which the steady state is below the saturation level for scavenging and transcription rate (i.e. Heq << K,W, corresponding to low external H2O2 levels), Heq can be approximated as:
| (19) |
with , and:
| (20) |
Therefore, this models implies that there is a sublinear dependency of both A and H with increasing stress level I, even for low external H2O2 levels, as indeed observed on Figures 1F and 6C. Noteworthy, the magnitude of the nonlinearity is controlled by three parameters: σ, which combines the saturation concentrations K and W, and the ratio ε/α, which represents the internal H2O2 concentration in the absence of scavenging and external H2O2.
G- Acquisition of tolerance
In our experiments (Figure 4), cells that have been pre-exposed to H2O2 display a lower burst of nuclear relocation of Yap1-GFP upon a mild subsequent challenging stress, compared to naive ones.
A numerical integration of Equations (1-3) according to the hypotheses of linear versus nonlinear feedback models is displayed in Figure 4—figure supplement 1E and F, using the same set of parameters as in Figure 6.
H- Summary of parameters values, data fitting procedures and numerical integration
Linear model
Parameters used in the linear model
| Parameter name | Value | Comment |
|---|---|---|
| ε | 0 or 0.2 mM min−1 | Basal H2O2 production rate in the absence of external H2O2. In the integral feedback case (μ’=0), the parameter value must be 0, otherwise there is no stable steady-state. |
| α | 1 min−1 | H2O2 transport rate across cell membrane. Value based on the order of magnitude of timings (~1 min) of nuclear relocation upon addition of H2O2 (taken from Figure 1—figure supplement 1C). |
| β | 5 min−1 | H2O2 scavenging rate. Derived from the absolute adaptation concentration Iabs in Figure 3. |
| γ | 0.03 or 0.53 min−1 | Antioxidant transcription rate. This parameter was adjusted to keep a constant value of Iabs when changing the mRNA decay rate (see below). |
| μ | variable | Antioxidant mRNA decay rate. In Figure 3B we used: μ=log(2)/2.5 min−1 to display the general properties of the dynamics of the system. In Figure 3C,F, we used: μ=log(2)/40 min−1, which provides a better agreement with experimental data, and corresponds to the actual order of magnitude of mRNA stability for TSA1 and other Prx genes(Geisberg et al., 2014). |
| γ’ | 0.01 min−1 | Antioxidant translation rate. Derived from the absolute adaptation concentration Iabs in Figure 3. |
| μ’ | log(2)/100 min−1 | Antioxidant protein decay rate. Tsa1 is a stable protein, therefore, the decay is due to the dilution rate set by cell growth (doubling time ~ 100 min). |
Data fitting procedure
Values for α, μ and μ’ are set by experimental constraints as described in the table above. γ, γ’ and β could not be determined individually using the experiments performed in this study, since absolute concentration of H, A and AmRNA could not be measured. However, these parameters are tightly linked to Iabs, which is the absolute H2O2 concentration at which cells can adapt (as described in section 1E in this document). Experimentally Iabs = 7.2 mM, as obtained in Figure 3—figure supplement 2F. Based on this measurement, putative values of γ, γ’ and βwere set to get the expected value of Iabs.
Nonlinear model
Parameters used in the nonlinear model
| Parameter name | Value | Comment |
|---|---|---|
| ε | 0.06 mM min−1 | Basal H2O2 production rate in the absence of external H2O2
Determined by a fitting procedure to data in Figure 6. |
| α | 1 min−1 | H2O2 transport rate across cell membrane. Taken from Figure 1—figure supplement 1C. |
| β | 10 mM−1 min−1 | H2O2 scavenging rate. Derived from the absolute adaptation concentration Iabs in Figure 3. |
| γ | 0.1 mM−1 min−1 | Antioxidant transcription rate. Derived from the absolute adaptation concentration Iabs in Figure 3. |
| μ | μ=log(2)/40 min−1 | Antioxidant mRNA decay rate. See the linear model above for the determination of parameter value. |
| γ’ | 0.005 mM−1 min−1 | Antioxidant translation rate. Derived from the absolute adaptation concentration Iabs in Figure 3. |
| μ’ | log(2)/100 min−1 | Antioxidant protein decay rate. Tsa1 is a stable protein, therefore, the decay is due to the dilution rate set by cell growth (doubling time ~ 100 min). |
| K | 0.01 mM | Order of magnitude of internal H2O2 at which antioxidant. transcription saturates. Taken from Figure 6—figure supplement 1C. |
| W | 0.01 mM | Order of magnitude of internal H2O2 at which H2O2 scavenging rate saturates. The ratio K/W ~ 1 gave the best fit to curves in Figure 6, hence the order of magnitude of this parameter. |
Data fitting procedure
In Figure 6, Tsa1-GFP level data fitting to the model (using chi2 minimization) allows to estimate the order of magnitude of ε, and the ratio K/W, assuming that other parameter values are similar to the linear model. Importantly, this parameter set is then used with no fit (other than a scaling factor due to the use of arbitrary units in experimental measurements) to compare the agreement between data and model in Figure 1 (steps), Figure 6 (ramps) and Figure 4 (tolerance). Unlike the linear model, this model is unique in its ability to describe the acquisition of tolerance in pre-exposed cells.
Numerical integration
Computing was performed using Matlab software. Numerical integration was based on the ode45 and ode15s functions.
Acknowledgements
We are grateful to Zhou Xu, Sophie Quintin, Nacho Molina, Robert Schneider and Julien Vermot for careful reading of the manuscript. This work was supported by the French Association pour la Recherche contre le Cancer (YG), the ATIP-Avenir program (GC), and a grant from the Fondation pour la Recherche Médicale (GC and MBT). This study was supported by the grant ANR-10-LABX-0030- INRT, a French State fund managed by the Agence Nationale de la Recherche under the frame program Investissements d’Avenir ANR-10- IDEX-0002-02.
Funding Statement
The funders had no role in study design, data collection and interpretation, or the decision to submit the work for publication.
Funding Information
This paper was supported by the following grants:
Association pour la Recherche sur le Cancer PDF20111204470 to Youlian Goulev.
Agence Nationale de la Recherche ERRed to Michel B Toledano.
Institut National Du Cancer PLBIO INCA_5869 to Michel B Toledano.
Institut National de la Santé et de la Recherche Médicale ATIP-Avenir program to Gilles Charvin.
Fondation pour la Recherche Médicale DEI20151234397 to Gilles Charvin.
Agence Nationale de la Recherche ANR-10-LABX-0030-INRT (French State fund ANR-10-IDEX-0002-02) to Gilles Charvin.
Additional information
Competing interests
The authors declare that no competing interests exist.
Author contributions
YG, Conceptualization, Resources, Data curation, Software, Formal analysis, Investigation, Methodology, Project administration, Writing—review and editing.
SM, Methodology, Designed the microfluidic device used for RLS analysis.
AM, Resources, Designed the yeast strains used in this study.
BH, Resources, Designed the yeast strains used in this study.
MM, Resources, Designed the yeast strains used in this study.
MBT, Conceptualization, Supervision, Writing—review and editing.
GC, Conceptualization, Data curation, Software, Formal analysis, Supervision, Funding acquisition, Visualization, Methodology, Writing—original draft, Project administration.
Additional files
Table listing the strains used in this study as well as additional information about the genotypes and the origins of the strains.
References
- Azevedo D, Tacnet F, Delaunay A, Rodrigues-Pousada C, Toledano MB. Two redox centers within Yap1 for H2O2 and thiol-reactive chemicals signaling. Free Radical Biology and Medicine. 2003;35:889–900. doi: 10.1016/S0891-5849(03)00434-9. [DOI] [PubMed] [Google Scholar]
- Barkai N, Leibler S. Robustness in simple biochemical networks. Nature. 1997;387:3–917. doi: 10.1038/43199. [DOI] [PubMed] [Google Scholar]
- Berg HC, Tedesco PM. Transient response to chemotactic stimuli in Escherichia coli. PNAS. 1975;72:3235–3239. doi: 10.1073/pnas.72.8.3235. [DOI] [PMC free article] [PubMed] [Google Scholar]
- Biteau B, Labarre J, Toledano MB. ATP-dependent reduction of cysteine-sulphinic acid by S. cerevisiae sulphiredoxin. Nature. 2003;425:980–984. doi: 10.1038/nature02075. [DOI] [PubMed] [Google Scholar]
- Branco MR, Marinho HS, Cyrne L, Antunes F. Decrease of H2O2 plasma membrane permeability during adaptation to H2O2 in Saccharomyces cerevisiae. The Journal of Biological Chemistry. 2004;279:1–6506. doi: 10.1074/jbc.M311818200. [DOI] [PubMed] [Google Scholar]
- Calabrese EJ, Dhawan G, Kapoor R, Iavicoli I, Calabrese V. What is hormesis and its relevance to healthy aging and longevity? Biogerontology. 2015;16:693–707. doi: 10.1007/s10522-015-9601-0. [DOI] [PubMed] [Google Scholar]
- Castillo-Hair SM, Igoshin OA, Tabor JJ. How to train your microbe: methods for dynamically characterizing gene networks. Current Opinion in Microbiology. 2015;24:113–123. doi: 10.1016/j.mib.2015.01.008. [DOI] [PMC free article] [PubMed] [Google Scholar]
- Charvin G. PhyloCell. eb666f7https://github.com/gcharvin/phyloCell Github. 2017
- Davies JM, Lowry CV, Davies KJ. Transient adaptation to oxidative stress in yeast. Archives of Biochemistry and Biophysics. 1995;317:1–6. doi: 10.1006/abbi.1995.1128. [DOI] [PubMed] [Google Scholar]
- Davies KJ. Adaptive homeostasis. Molecular Aspects of Medicine. 2016;49:1–7. doi: 10.1016/j.mam.2016.04.007. [DOI] [PMC free article] [PubMed] [Google Scholar]
- El-Samad H, Goff JP, Khammash M. Calcium homeostasis and parturient hypocalcemia: an integral feedback perspective. Journal of Theoretical Biology. 2002;214:17–29. doi: 10.1006/jtbi.2001.2422. [DOI] [PubMed] [Google Scholar]
- Fehrmann S, Paoletti C, Goulev Y, Ungureanu A, Aguilaniu H, Charvin G. Aging yeast cells undergo a sharp entry into senescence unrelated to the loss of mitochondrial membrane potential. Cell Reports. 2013;5:1589–1599. doi: 10.1016/j.celrep.2013.11.013. [DOI] [PubMed] [Google Scholar]
- Gasch AP, Spellman PT, Kao CM, Carmel-Harel O, Eisen MB, Storz G, Botstein D, Brown PO. Genomic expression programs in the response of yeast cells to environmental changes. Molecular Biology of the Cell. 2000;11:4241–4257. doi: 10.1091/mbc.11.12.4241. [DOI] [PMC free article] [PubMed] [Google Scholar]
- Geisberg JV, Moqtaderi Z, Fan X, Ozsolak F, Struhl K. Global analysis of mRNA isoform half-lives reveals stabilizing and destabilizing elements in yeast. Cell. 2014;156:812–824. doi: 10.1016/j.cell.2013.12.026. [DOI] [PMC free article] [PubMed] [Google Scholar]
- Godon C, Lagniel G, Lee J, Buhler JM, Kieffer S, Perrot M, Boucherie H, Toledano MB, Labarre J. The H2O2 stimulon in Saccharomyces cerevisiae. Journal of Biological Chemistry. 1998;273:22480–22489. doi: 10.1074/jbc.273.35.22480. [DOI] [PubMed] [Google Scholar]
- Guan Q, Haroon S, Bravo DG, Will JL, Gasch AP. Cellular memory of acquired stress resistance in Saccharomyces cerevisiae. Genetics. 2012;192:495–505. doi: 10.1534/genetics.112.143016. [DOI] [PMC free article] [PubMed] [Google Scholar]
- Hanzén S, Vielfort K, Yang J, Roger F, Andersson V, Zamarbide-Forés S, Andersson R, Malm L, Palais G, Biteau B, Liu B, Toledano MB, Molin M, Nyström T. Lifespan Control by Redox-Dependent recruitment of Chaperones to misfolded proteins. Cell. 2016;166:140–151. doi: 10.1016/j.cell.2016.05.006. [DOI] [PubMed] [Google Scholar]
- Hecker M, Pané-Farré J, Völker U. SigB-dependent general stress response in Bacillus subtilis and related gram-positive bacteria. Annual Review of Microbiology. 2007;61:215–236. doi: 10.1146/annurev.micro.61.080706.093445. [DOI] [PubMed] [Google Scholar]
- Huber F, Meurer M, Bunina D, Kats I, Maeder CI, Stefl M, Mongis C, Knop M. PCR duplication: a One-Step Cloning-Free Method to generate Duplicated chromosomal loci and Interference-Free expression reporters in yeast. PLoS One. 2014;9:e114590. doi: 10.1371/journal.pone.0114590. [DOI] [PMC free article] [PubMed] [Google Scholar]
- Huh WK, Falvo JV, Gerke LC, Carroll AS, Howson RW, Weissman JS, O'Shea EK. Global analysis of protein localization in budding yeast. Nature. 2003;425:686–691. doi: 10.1038/nature02026. [DOI] [PubMed] [Google Scholar]
- Inoue Y, Matsuda T, Sugiyama K, Izawa S, Kimura A. Genetic analysis of glutathione peroxidase in oxidative stress response of Saccharomyces cerevisiae. Journal of Biological Chemistry. 1999;274:27002–27009. doi: 10.1074/jbc.274.38.27002. [DOI] [PubMed] [Google Scholar]
- Jang HH, Lee KO, Chi YH, Jung BG, Park SK, Park JH, Lee JR, Lee SS, Moon JC, Yun JW, Choi YO, Kim WY, Kang JS, Cheong GW, Yun DJ, Rhee SG, Cho MJ, Lee SY. Two enzymes in one; two yeast peroxiredoxins display oxidative stress-dependent switching from a peroxidase to a molecular chaperone function. Cell. 2004;117:625–635. doi: 10.1016/j.cell.2004.05.002. [DOI] [PubMed] [Google Scholar]
- Jiang H, English AM. Phenotypic analysis of the ccp1Delta and ccp1Delta-ccp1W191F mutant strains of Saccharomyces cerevisiae indicates that cytochrome c peroxidase functions in oxidative-stress signaling. Journal of Inorganic Biochemistry. 2006;100:1996–2008. doi: 10.1016/j.jinorgbio.2006.07.017. [DOI] [PubMed] [Google Scholar]
- Kandror O, Bretschneider N, Kreydin E, Cavalieri D, Goldberg AL. Yeast adapt to near-freezing temperatures by STRE/Msn2,4-dependent induction of trehalose synthesis and certain molecular chaperones. Molecular Cell. 2004;13:771–781. doi: 10.1016/S1097-2765(04)00148-0. [DOI] [PubMed] [Google Scholar]
- Kensler TW, Wakabayashi N, Biswal S. Cell survival responses to environmental stresses via the Keap1-Nrf2-ARE pathway. Annual Review of Pharmacology and Toxicology. 2007;47:89–116. doi: 10.1146/annurev.pharmtox.46.120604.141046. [DOI] [PubMed] [Google Scholar]
- Khammash M. An engineering viewpoint on biological robustness. BMC Biology. 2016;14:22. doi: 10.1186/s12915-016-0241-x. [DOI] [PMC free article] [PubMed] [Google Scholar]
- Kuge S, Jones N. YAP1 dependent activation of TRX2 is essential for the response of Saccharomyces cerevisiae to oxidative stress by hydroperoxides. The EMBO Journal. 1994;13:5–664. doi: 10.1002/j.1460-2075.1994.tb06304.x. [DOI] [PMC free article] [PubMed] [Google Scholar]
- Kuge S, Jones N, Nomoto A. Regulation of yAP-1 nuclear localization in response to oxidative stress. The EMBO Journal. 1997;16:1710–1720. doi: 10.1093/emboj/16.7.1710. [DOI] [PMC free article] [PubMed] [Google Scholar]
- Lee J, Godon C, Lagniel G, Spector D, Garin J, Labarre J, Toledano MB. Yap1 and Skn7 control two specialized oxidative stress response regulons in yeast. Journal of Biological Chemistry. 1999;274:16040–16046. doi: 10.1074/jbc.274.23.16040. [DOI] [PubMed] [Google Scholar]
- Lewis JG, Learmonth RP, Watson K. Induction of heat, freezing and salt tolerance by heat and salt shock in Saccharomyces cerevisiae. Microbiology. 1995;141 ( Pt 3:687–694. doi: 10.1099/13500872-141-3-687. [DOI] [PubMed] [Google Scholar]
- Lindquist S. The heat-shock response. Annual Review of Biochemistry. 1986;55:1151–1191. doi: 10.1146/annurev.bi.55.070186.005443. [DOI] [PubMed] [Google Scholar]
- Lou Y, Yousef AE. Adaptation to sublethal environmental stresses protects Listeria monocytogenes against lethal preservation factors. Applied and Environmental Microbiology. 1997;63:2–1255. doi: 10.1128/aem.63.4.1252-1255.1997. [DOI] [PMC free article] [PubMed] [Google Scholar]
- Low FM, Hampton MB, Peskin AV, Winterbourn CC. Peroxiredoxin 2 functions as a noncatalytic scavenger of low-level hydrogen peroxide in the erythrocyte. Blood. 2007;109:2611–2617. doi: 10.1182/blood-2006-09-048728. [DOI] [PubMed] [Google Scholar]
- Lu D, Maulik N, Moraru II, Kreutzer DL, Das DK. Molecular adaptation of vascular endothelial cells to oxidative stress. The American Journal of Physiology. 1993;264:C715–C722. doi: 10.1152/ajpcell.1993.264.3.C715. [DOI] [PubMed] [Google Scholar]
- Ma W, Trusina A, El-Samad H, Lim WA, Tang C. Defining network topologies that can achieve biochemical adaptation. Cell. 2009;138:760–773. doi: 10.1016/j.cell.2009.06.013. [DOI] [PMC free article] [PubMed] [Google Scholar]
- Mesquita A, Weinberger M, Silva A, Sampaio-Marques B, Almeida B, Leão C, Costa V, Rodrigues F, Burhans WC, Ludovico P. Caloric restriction or catalase inactivation extends yeast chronological lifespan by inducing H2O2 and superoxide dismutase activity. PNAS. 2010;107:15123–15128. doi: 10.1073/pnas.1004432107. [DOI] [PMC free article] [PubMed] [Google Scholar]
- Mitchell A, Romano GH, Groisman B, Yona A, Dekel E, Kupiec M, Dahan O, Pilpel Y. Adaptive prediction of environmental changes by microorganisms. Nature. 2009;460:220–224. doi: 10.1038/nature08112. [DOI] [PubMed] [Google Scholar]
- Molin M, Yang J, Hanzén S, Toledano MB, Labarre J, Nyström T. Life span extension and H(2)O(2) resistance elicited by caloric restriction require the peroxiredoxin Tsa1 in Saccharomyces cerevisiae. Molecular Cell. 2011;43:823–833. doi: 10.1016/j.molcel.2011.07.027. [DOI] [PubMed] [Google Scholar]
- Muzzey D, van Oudenaarden A. Quantitative Time-Lapse fluorescence microscopy in single cells. Annual Review of Cell and Developmental Biology. 2009;25:301–327. doi: 10.1146/annurev.cellbio.042308.113408. [DOI] [PMC free article] [PubMed] [Google Scholar]
- Muzzey D, Gómez-Uribe CA, Mettetal JT, van Oudenaarden A. A systems-level analysis of perfect adaptation in yeast osmoregulation. Cell. 2009;138:160–171. doi: 10.1016/j.cell.2009.04.047. [DOI] [PMC free article] [PubMed] [Google Scholar]
- Paoletti C, Quintin S, Matifas A, Charvin G. Kinetics of formation and asymmetrical distribution of Hsp104-Bound protein aggregates in yeast. Biophysical Journal. 2016;110:1605–1614. doi: 10.1016/j.bpj.2016.02.034. [DOI] [PMC free article] [PubMed] [Google Scholar]
- Ristow M, Schmeisser S. Extending life span by increasing oxidative stress. Free Radical Biology and Medicine. 2011;51:327–336. doi: 10.1016/j.freeradbiomed.2011.05.010. [DOI] [PubMed] [Google Scholar]
- Scholz H, Franz M, Heberlein U. The hangover gene defines a stress pathway required for ethanol tolerance development. Nature. 2005;436:845–847. doi: 10.1038/nature03864. [DOI] [PMC free article] [PubMed] [Google Scholar]
- Sikorski RS, Hieter P. A system of shuttle vectors and yeast host strains designed for efficient manipulation of DNA in Saccharomyces cerevisiae. Genetics. 1989;122:19–27. doi: 10.1093/genetics/122.1.19. [DOI] [PMC free article] [PubMed] [Google Scholar]
- Sorre B, Warmflash A, Brivanlou AH, Siggia ED. Encoding of temporal signals by the TGF-β pathway and implications for embryonic patterning. Developmental Cell. 2014;30:334–342. doi: 10.1016/j.devcel.2014.05.022. [DOI] [PMC free article] [PubMed] [Google Scholar]
- Toledano MB, Delaunay A, Monceau L, Tacnet F. Microbial H2O2 sensors as archetypical redox signaling modules. Trends in Biochemical Sciences. 2004;29:351–357. doi: 10.1016/j.tibs.2004.05.005. [DOI] [PubMed] [Google Scholar]
- Valle G, Carmignani M, Stanislao M, Facciorusso A, Volpe AR. Mithridates VI Eupator of Pontus and Mithridatism. Allergy. 2012;67:8–139. doi: 10.1111/j.1398-9995.2011.02700.x. [DOI] [PubMed] [Google Scholar]
- Weids AJ, Grant CM. The yeast peroxiredoxin Tsa1 protects against protein-aggregate-induced oxidative stress. Journal of Cell Science. 2014;127:1327–1335. doi: 10.1242/jcs.144022. [DOI] [PMC free article] [PubMed] [Google Scholar]
- Whitacre JM. Biological robustness: paradigms, mechanisms, and systems principles. Frontiers in Genetics. 2012;3:67. doi: 10.3389/fgene.2012.00067. [DOI] [PMC free article] [PubMed] [Google Scholar]
- Yi TM, Huang Y, Simon MI, Doyle J. Robust perfect adaptation in bacterial chemotaxis through integral feedback control. PNAS. 2000;97:4649–4653. doi: 10.1073/pnas.97.9.4649. [DOI] [PMC free article] [PubMed] [Google Scholar]
- Young JW, Locke JC, Elowitz MB. Rate of environmental change determines stress response specificity. PNAS. 2013;110:4140–4145. doi: 10.1073/pnas.1213060110. [DOI] [PMC free article] [PubMed] [Google Scholar]
- Zhang Q, Andersen ME. Dose response relationship in anti-stress gene regulatory networks. PLoS Computational Biology. 2007;3:e24. doi: 10.1371/journal.pcbi.0030024. [DOI] [PMC free article] [PubMed] [Google Scholar]
- Zhang Q, Pi J, Woods CG, Andersen ME. A systems biology perspective on Nrf2-mediated antioxidant response. Toxicology and Applied Pharmacology. 2010;244:84–97. doi: 10.1016/j.taap.2009.08.018. [DOI] [PMC free article] [PubMed] [Google Scholar]


