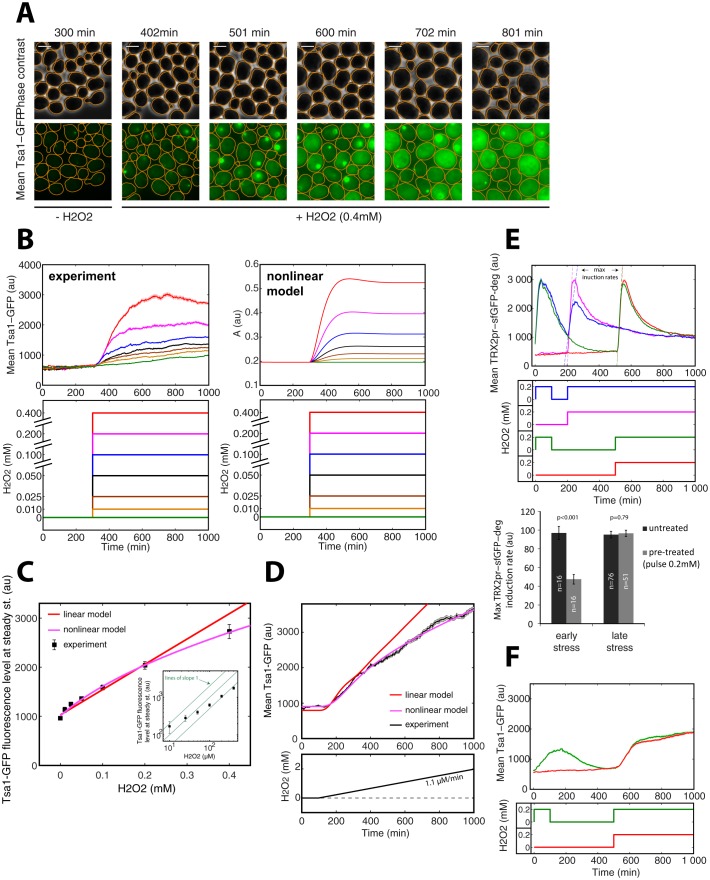
Figure 6. Tsa1 scaling properties.
(A) Sequence of phase-contrast and fluorescence images of individual cells at the indicated times after initiation (t = 300 min) of a 0.4 mM step in H2O2 concentration. The green channel represents the Tsa1-GFP signal. The white bars represent 5 µm. (B) Left: Mean cell expression (top) of Tsa1-GFP following the H2O2 steps indicated in the bottom panel. Right: Dynamics of antioxidant level with increasing stress, as expected from the nonlinear model. (C) Quantification of mean cell expression of Tsa1-GFP at steady state as a function of H2O2 concentration (from experiments in (B)). Colored lines indicate the fit of the linear (red) and nonlinear (magenta) models. Inset: log-log representation of Tsa1-GFP level with H2O2 level. Green lines indicate lines of slope one on a log-log scale, to emphasize the nonlinearity of Tsa1-GFP expression. (D) Mean Tsa1-GFP expression (top) during a ramp experiment, as indicated in the bottom panel. Colored lines indicate the fit of the linear (red) and nonlinear (magenta) models. (E) Top: Mean cellular transcription of the TRX2 promoter for cells exposed to the temporal H2O2 profiles described in the middle panel (with corresponding color coding). Bottom: Quantification of maximal transcriptional output during a step experiment performed at t = 200 min (early stress) or 500 min (late stress) with or without pretreatment. Student’s t-test. (F) Mean cellular expression of Tsa1-GFP for cells exposed to the temporal H2O2 profiles described in the bottom panel. Error bars and shaded regions are SEM (B,D-F: N > 100 for most time points, C: N > 100).


