. 2017 May 10;6:e26886. doi: 10.7554/eLife.26886

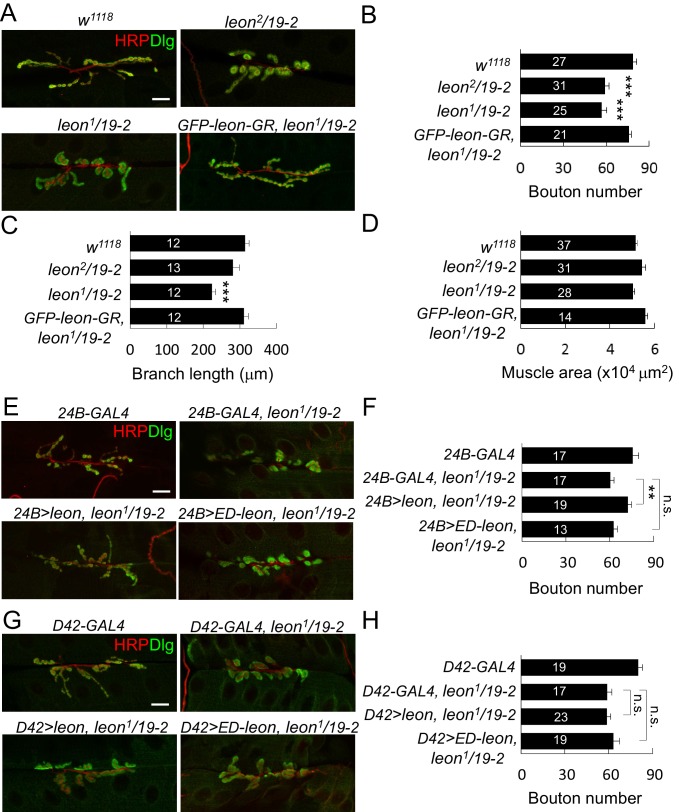
Figure 1. leon mutants display abnormal NMJ morphology.

(A) Immunostaining images show NMJs of w1118, leon2/19-2, leon1/19-2 and GFP-leon-GR, leon1/19-2 for HRP (red) and Dlg (green). (B–D) Bar graphs show means ± SEM (standard error of mean) of bouton numbers (B), branch lengths (C) and muscle areas (D, quantified by phalloidin staining, not shown). (E and G) Immunostaining images co-stained by HRP (red) and Dlg (green) show transgene rescue of leon1/19-2 NMJs by UAS-leon or UAS-ED-leon driven by postsynaptic 24B-GAL4 (E) or presynaptic D42-GAL4 (G). (F and H) Bar graphs show means ± SEM of bouton numbers in postsynaptic or presynaptic rescue. Scale bars, 20 μm. All data were compared to controls unless specifically indicated by brackets, with n.s. indicating no significance, * for p<0.05, and *** for p<0.001 according to Student’s t tests. The detail statistic numbers also see Supplementary file 1.

DOI: http://dx.doi.org/10.7554/eLife.26886.002

Figure 1.

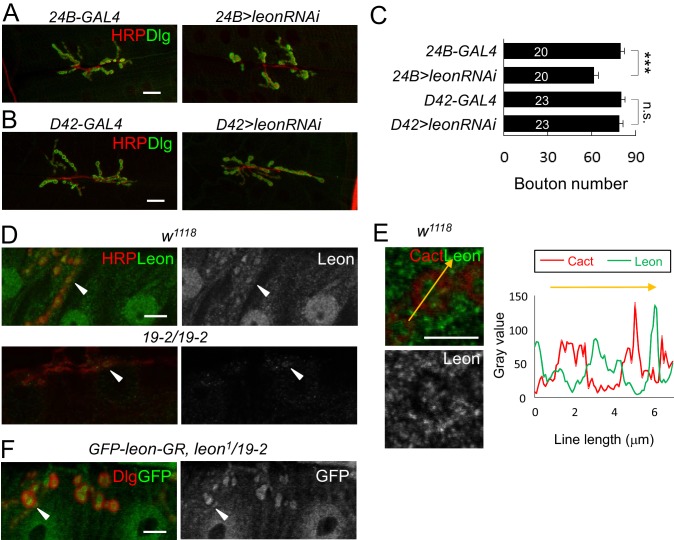
Figure 1—figure supplement 1. Postsynaptic leon in NMJ morphology and Leon expression pattern.

Figure 1—figure supplement 1.

(A,B) Immunostaining images co-stained by HRP (red) and Dlg (green) show bouton number reduction in UAS-leonRNAi driven by postsynaptic 24B-GAL4 (A), but not by presynaptic D42-GAL4 (B). Scale bars, 20 μm. (C) Bar graphs show means ± SEM of bouton number in 24B-GAL4, 24B>leonRNAi, D42-GAL4, and D42>leonRNAi. Pairwise comparisons are shown by brackets with n.s. indicating no significance and *** for p<0.001 according to Student’s t tests. The detail statistic numbers also see Supplementary file 1. (D) Immunostaining images of NMJs for Leon (green) and HRP (red) show that Leon is expressed in muscles and NMJs (arrowhead) of w1118, and Leon signals are largely diminished in 19-2/19-2. The single Leon images (right panels) are also shown. Scale bar, 10 μm. (E) Enlarged images show expressions of Leon (green) and Cact (red), or Leon only (bottom), in a single bouton. Scale bar, 5 μm. The orange-colored arrow crossing the bouton was quantified for the intensities (gray value) of Cact and Leon (right panel). (F) Immunostaining images of NMJs for GFP (green) and Dlg (red) show expressions of GFP-leon-GR in leon1/19-2, similar to endogenous Leon expression. The single GFP image (right) is also shown. Scale bar, 10 μm.