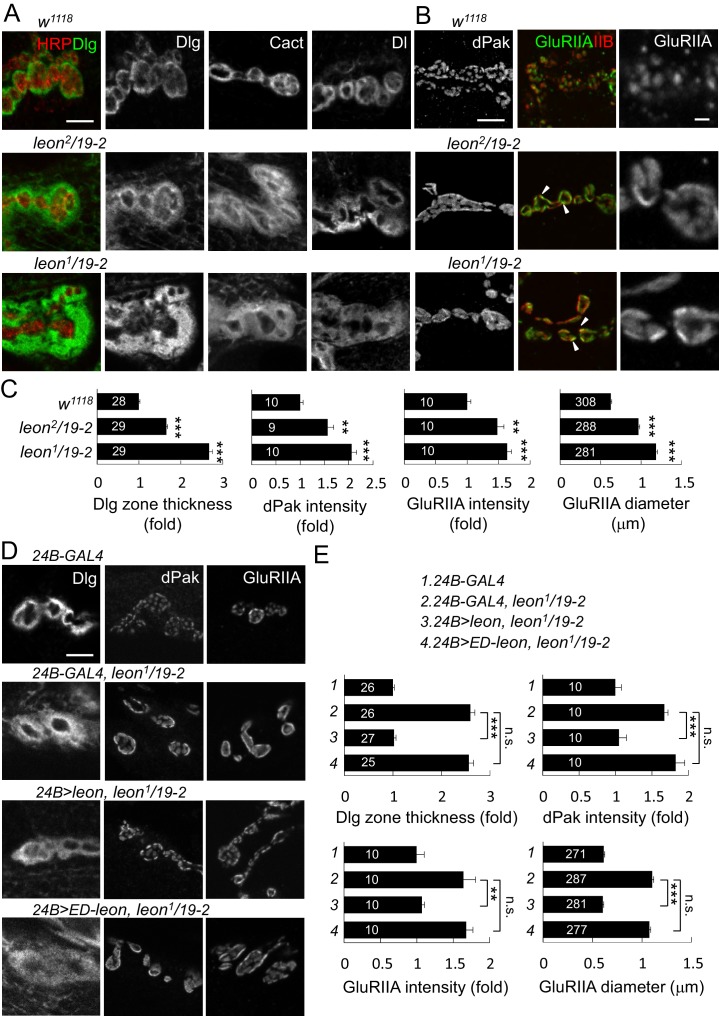
Figure 3. Expansion of SSR- and PSD-localized proteins at leon NMJs.
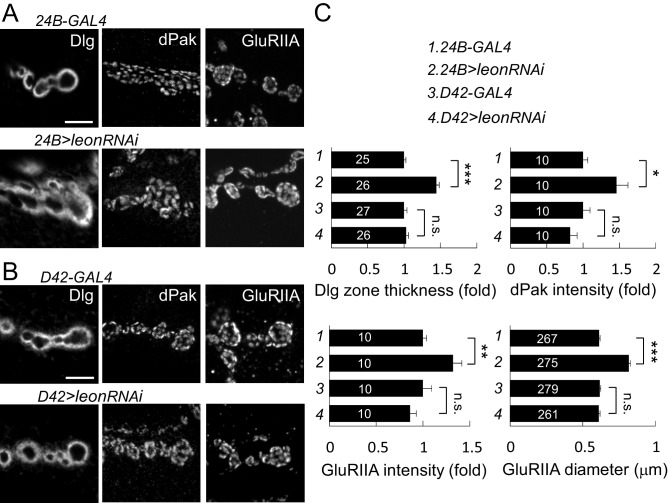
(A) Images show SSR-localized proteins Dlg, Cact and Dl in immunostaining of boutons in w1118, leon2/19-2 and leon1/19-2. Co-staining of Dlg (green) and HRP (red) is shown (left panels). (B) Images show PSD-localized dPak, GluRIIA and GluRIIB immunostaining at synapses of w1118, leon2/19-2 and leon1/19-2. Arrowheads indicate overlapping signals of expanded GluRIIA (green) and GluRIIB (red) clusters in middle panels. GluRIIA images are shown with magnification (right panels). (C) Bar graphs show means ± SEM of Dlg-positive zone thickness, dPak intensity and GluRIIA intensity and diameter in w1118, leon2/19-2 and leon1/19-2. (D) Images show Dlg, dPak and GluRIIA immunostaining at NMJs, with postsynaptic 24B-GAL4-driven UAS-leon or UAS-ED-leon expression in leon1/19-2. (E) Bar graphs show means ± SEM of Dlg-positive zone thickness, dPak intensity and GluRIIA intensity and diameter. All scale bars represent 5 μm except in magnified GluRIIA images, which is 1 μm. All data were compared to controls unless specifically indicated by brackets with n.s. indicating no significance, ** for p<0.01 and *** for p<0.001 according to Student’s t tests. The detail statistic numbers also see Supplementary file 1.

