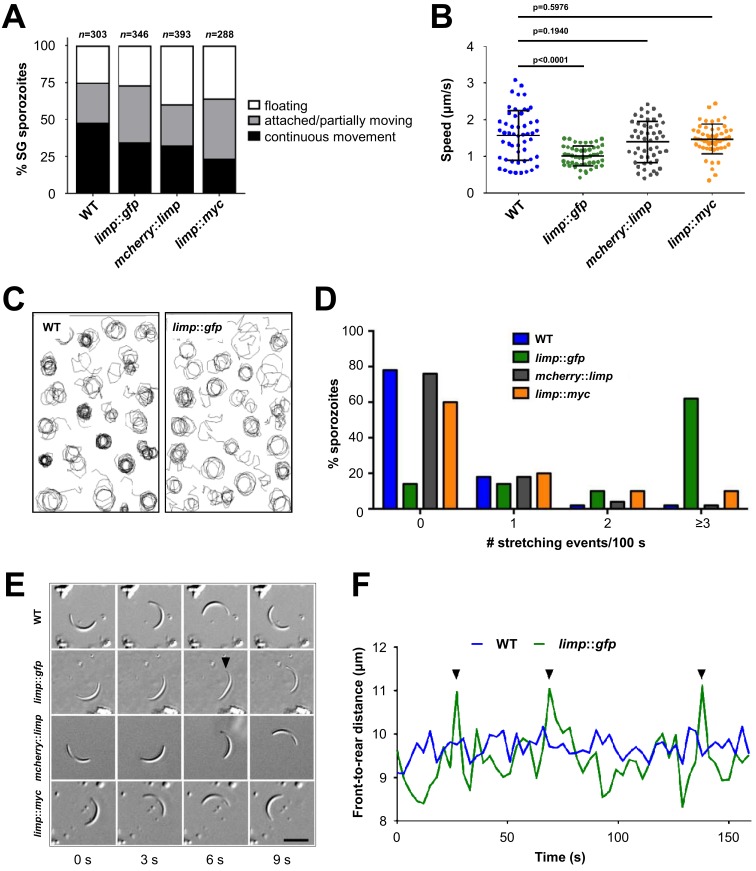
Figure 5. limp::gfp salivary gland sporozoites glide with a ‘limp’.
(A) The percentage of circular moving limp::gfp salivary gland (SG) sporozoites is comparable to WT, mcherry::limp and limp::myc sporozoites. Four independent experiments were performed for each parasite line to obtain indicated numbers of sporozoites. (B) Moving limp::gfp salivary gland sporozoites show significantly reduced gliding speed, whereas neither mcherry::limp nor limp::myc parasites reveal a speed reduction. Lines show means±SD; p-values for one-way ANOVA with Dunnett's post-hoc test. For each line, 50–53 sporozoites were analysed. Data for all lines represent three independent experiments. (C) Maximum projections of a representative subset of WT and limp::gfp moving sporozoites tracked in (B). (D) limp::gfp sporozoites show higher frequency of stretching events compared to WT, mcherry::limp and limp::myc parasites. Percentage of sporozoites within each stretching frequency category are shown by the bars. Fifty sporozoites were analysed per parasite line. Data for all lines are from three independent experiments. (E) Consecutive bright-field images of representative gliding WT, limp::gfp, mcherry::limp and limp::myc sporozoites. Arrowhead indicates the apical tip of a stretched sporozoite. Scale bar = 10 µm. (F) Distance between front and rear ends of one representative sporozoite for WT and limp::gfp, respectively. The distance was analysed over 159 s. Arrowheads indicate stretching events of limp::gfp parasites.

