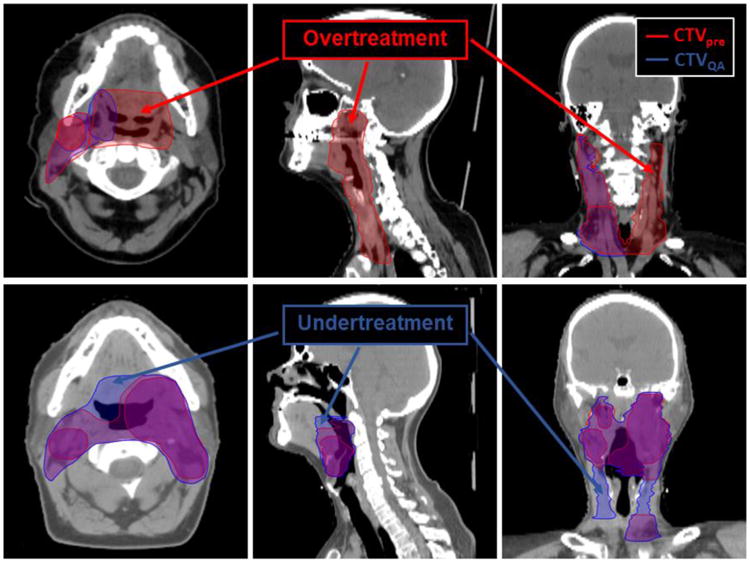
Fig. 1.

Patient images showing differences in clinical target volume (CTV) changes and their effect on false negative Dice (FND) and false positive Dice (FPD) metrics. Top row, simulation CT images for a patient with T1N1 cancer of the right tonsil. Differences in contours before (red) and after (blue) quality assurance (QA) are visualized. For this patient, high FND and Dice similarity coefficient (overtreatment) values were recorded for CTV1 and CTV3, as can be visually assessed on the axial and coronal images. Bottom row, a patient with T4N2c of the left tonsil who was treated with definitive radiation therapy. CTV volumes after QA (blue) show regions that were added and could be considered potential near misses.
