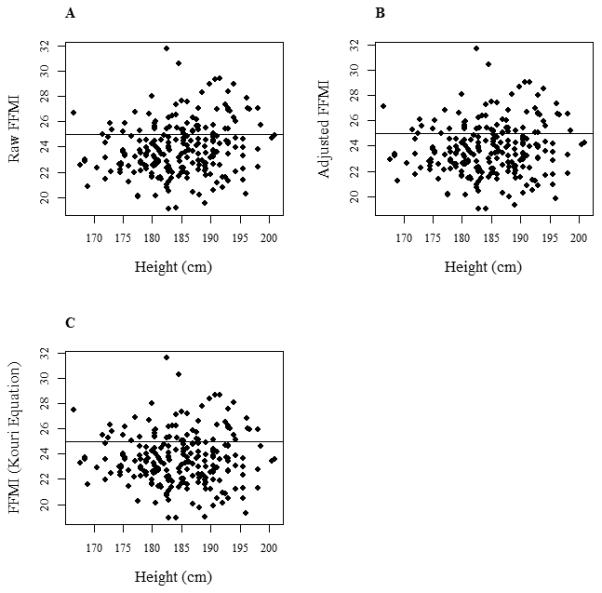
Figure 1.

(A) Raw FFMI values (kg·m−2) plotted against height. (B) FFMI values plotted against height, after using regression to adjust for height (FFMIAdj). (C) FFMI values plotted against height, after using previously published equation by Kouri et al. (20) to adjust for height (FFMIKE). Horizontal line represents previously reported upper limit value of 25 kg·m−2 (20).
