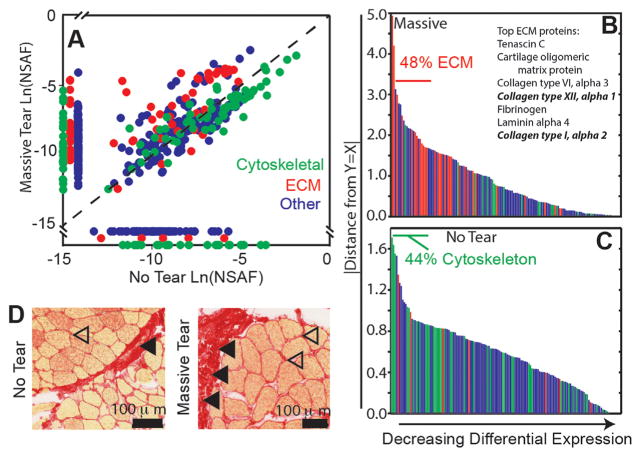
Figure 5.
Mass spectroscopy reveals that muscle composition varies with disease state. (A) Natural log of mean normalized spectral abundance factors (NSAFs) plotted for massive tear (n = 3) versus no tear (n = 4). Dashed line is y = x reference line. Proteins are colored by gene ontology (GO) terms for cytoskeletal (green), ECM (red), and other (blue). Proteins expressed in either massive tear or no tear samples but not both are located along each respective axis. (B, C) The absolute value of the distance from each point to the y = x reference line was calculated to indicate differential protein expression. Panel B indicates those proteins expressed at higher levels in massive tear samples (i.e., to the left of the y = x line), while panel C indicates those expressed at higher levels in no tear samples. Panel B also annotates those ECM proteins that had the highest overall expression, with fibrillar collagens noted in bold. (D) Representative images of picrosirius red staining of no tear and massive tear samples show increased ECM content and collagen deposition in massive tear samples, with some collagen deposition in no tears likely due to bursitis.

