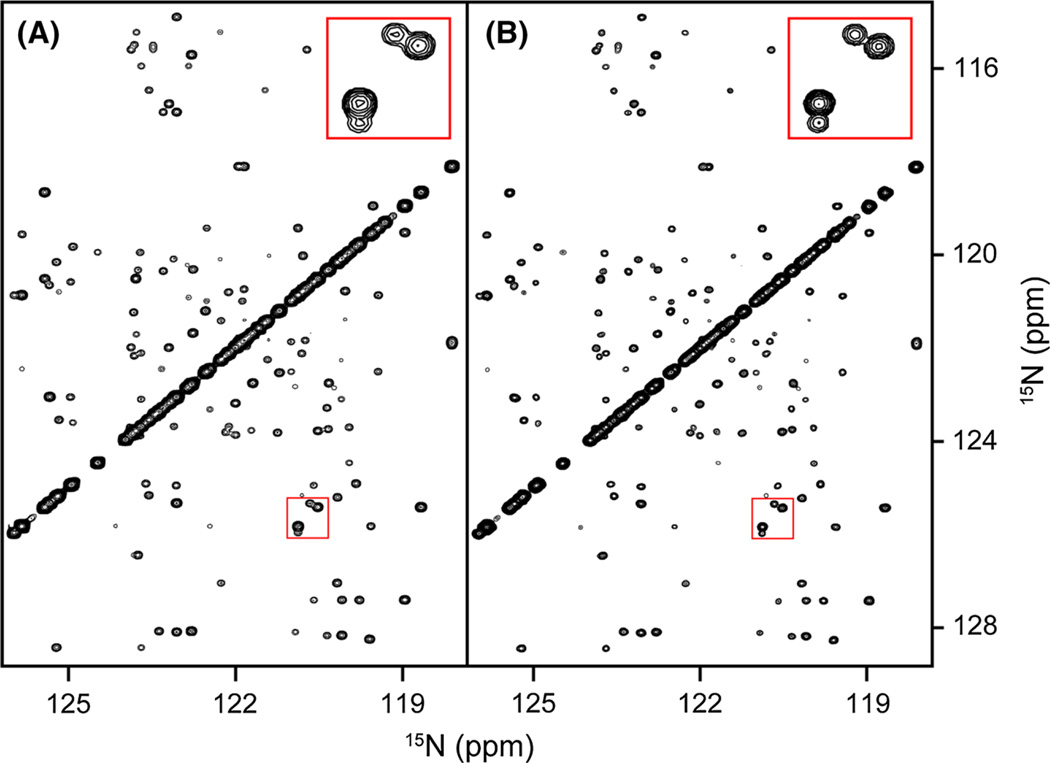
Fig. 3.
Comparison of spectra obtained from a fully sampled matrix with that of a NUS-processed, randomly chosen 2.6% subset of that matrix. Shown are sections of the projection of a 600-MHz 3D (H)N(COCO)NH spectrum of α-synuclein on the 2D 15N–15N plane for A the fully sampled data set and B the SMILE-reconstructed data set. The indirect 15N dimensions in the fully sampled and SMILE reconstructed spectra were apodized using a cosine window ending at 86.4°. The default 50% extension in the indirect time domains, by adding zeros for the non-sampled time domain, makes the effective sparsity 1.15%, and improves spectral resolution as highlighted for the peaks in the insets shown at the top right of each panel. Final matrix size for the absorptive, real component of the spectrum is 928 × 928 × 464 points, i.e., 1.5 Gb; reconstruction time 14.6 min, using 4 Intel Xeon E5-2650 CPU cores, 1 Gb total memory, 300 SMILE iterations. The NMRPipe processing script is included as Supplementary Material

